Since IE 11 is no longer available and support for it has ended, how do you view trace log xml files in a coherent easy to understand manner?
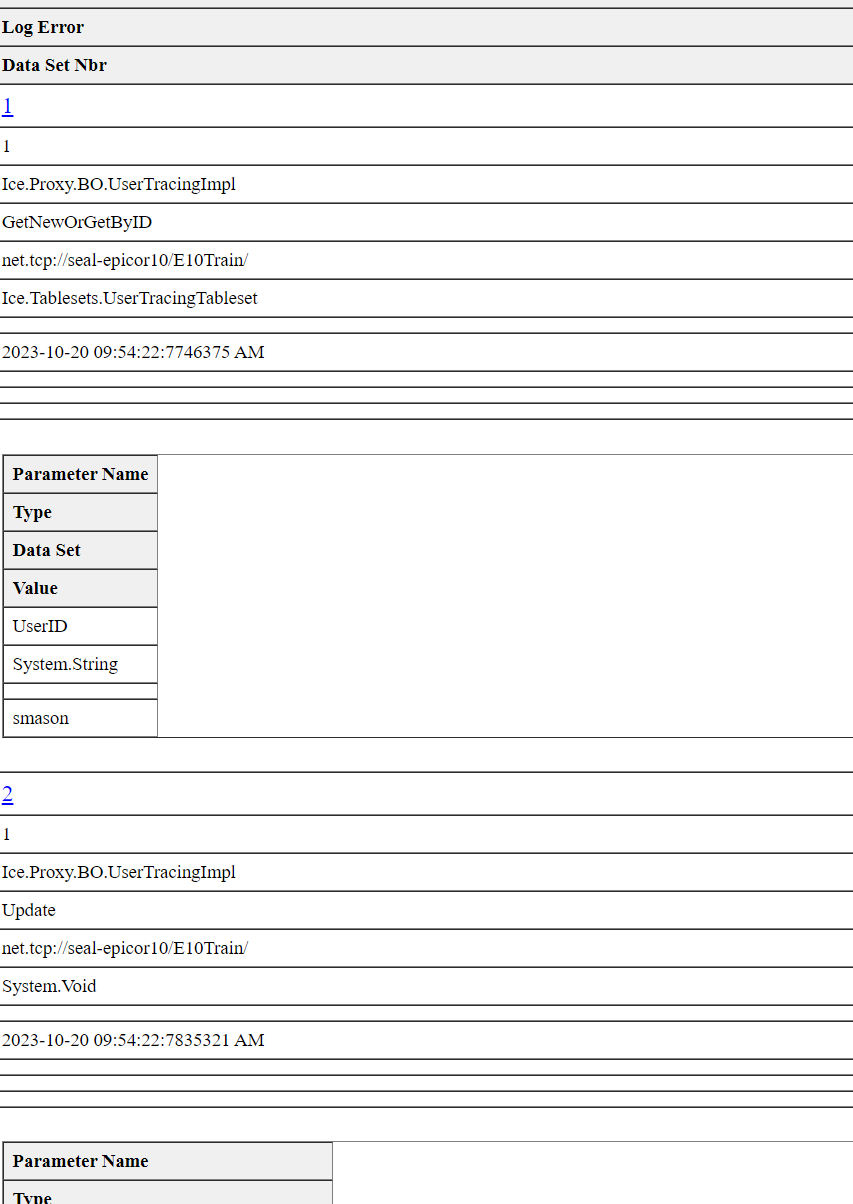
I can view a raw XML file in VSCode or another text editor but the format makes it difficult to follow. I tried using VSCode live server and that is a little better but still manages to screw up the table structure. It just lists everything vertically:
Jose makes things that work quite nicely! EDIT: I thought josh also did this, but didn’t confirm my suspicion so I just said Jose, but @jgiese.wci also had a part in this awesome tool!
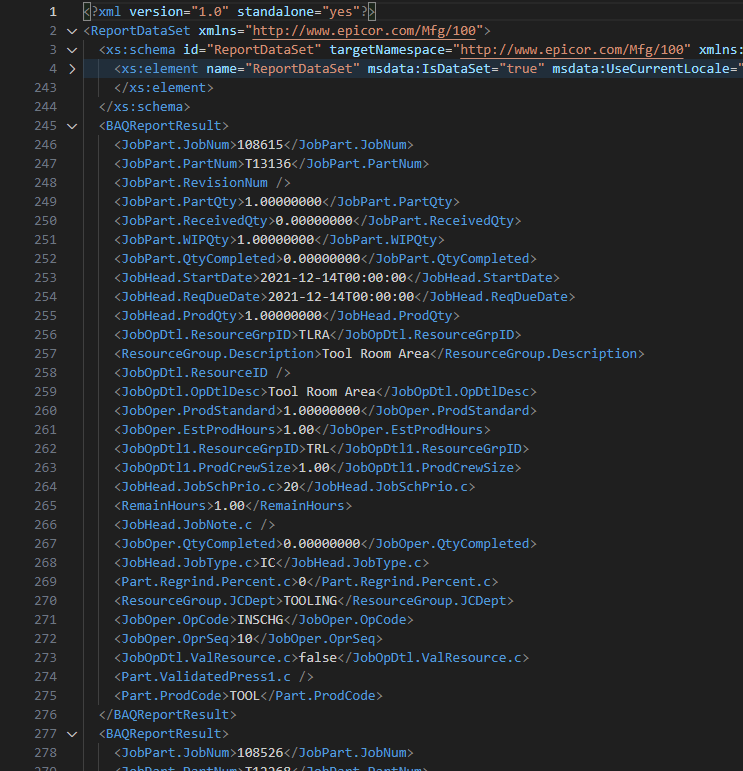
I was looking for something that has visual tables, like actually applying the styles defined in the XSL file. Reading the XML in native format is tiresome on the eyes even with code folding.
But the reason I actually need it is so that I can figure out REST payloads so in that instance using the Epicor Trace Viewer tool is actually much better.
I might offer some feedback to Jose and Josh if they still develop it:
The sort button inside the tool is one way isn’t it? Maybe a sort alpha and sort chronological by call would be helpful. The only way to get back to chronological is if you close and open it.
Also if Epicor is still open it locks the trace file and the tool errors out and won’t let you open it until you close Epicor.
Another tab next ot Method Trace Info to view the entire file at once?
How about an option to format as JSON or C#
If they don’t then no worries, it’s a million times better than reading raw XML in VSCode or elsewhere.