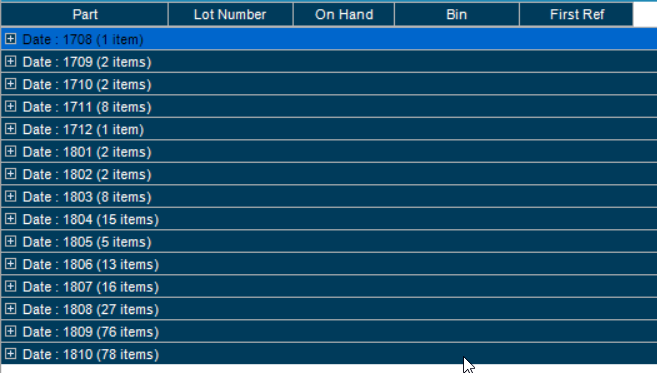
I’m attempting to do something that seems like it should be exceedingly simple but I can’t seem to wrap my had around the process this morning. I want to build a line graph that shows a trend across a period of time (from 8/2017 to present). I need this to be by month and for each month I just need a record count. See image:
Based on this image, along the x-axis there should be August 2017 - November 2017 and the Y-axis should show 1 for August, 2 for Sept, 2 for Oct, and 8 for November. I don’t need to show any more detail in the graph than that as the user can get the details from the dashboard itself.
Has anyone done something like his or have some idea as to how to accomplish this?
I’m assuming you made a BAQ, did you put that into a dashboard?
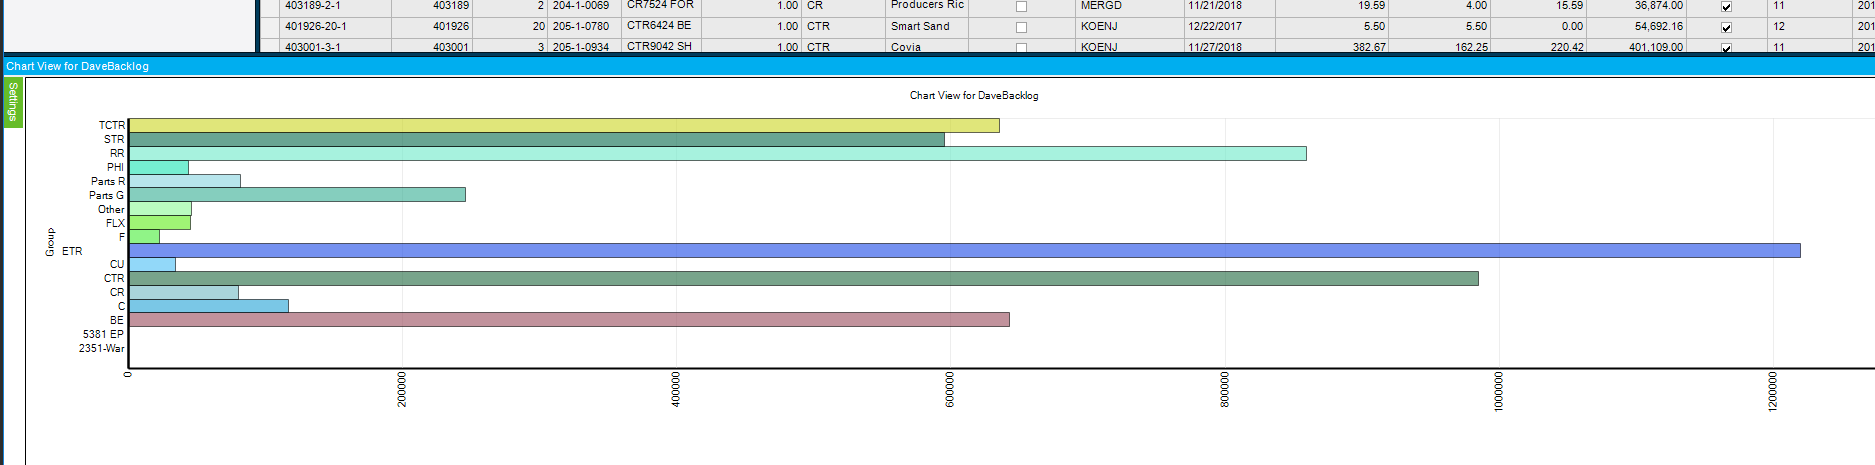
Have you tried the chart in dashboard? There are lots of charts to pick from. Let me know if you need details on how to use it.
For your use case, you will probably need to make a calculated field with month and year only it it so that you can group by that. (do the calculated field year first, then month so it sorts logically)
Thanks for the reply. Yes, I’ve tried several versions of charts in the dashboard with no luck. I need to find a way to get that record count. I think that your calculated field suggestion is a step in the right direction but it still doesn’t give me a count that I can use for the Y axis. The only option I’m given for Y is OnHand Qty The silly thing about this is that I could literally draw this graph by hand in about 30 seconds (x=month, y=record count/month).
Can your BAQ have a top level query with the month (you might need to add a calculated field in this level for just the month rather than the whole date), then COUNT(Part) with group by that month field?
post your calculated field, or some screen shots of it. The count is something you can double click in the menu to use, you shouldn’t have to type anything.
It’s probably the date thing messing you up. (I had problems with that before too, very frustrating)
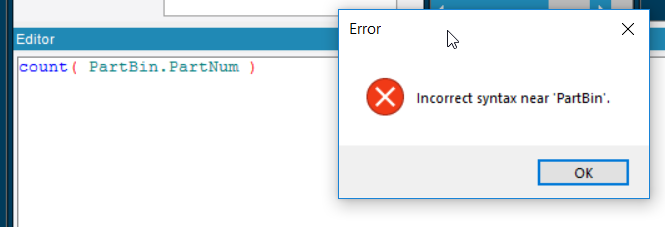
Try this in your date chop up and see if the syntax error goes away.
I have to find the code that works better for the month so that it doesn’t sort it 1,11,12,2 etc. You need 01, 02 in there to sort it correctly. I have it some of my queries and it’s on the forum here somewhere.
Side note, PartBin doesn’t have any history in the table. Only what is currently in BINS. If the bin goes to 0, the Row is gone. If you want to see transaction history, you are going to need a table like PartTran. I’m not exactly sure what you are trying to accomplish, but from your description, it looks like you are looking for something historical.
select
[PartBin].[PartNum] as [PartBin_PartNum],
[PartBin].[LotNum] as [PartBin_LotNum],
[PartBin].[OnhandQty] as [PartBin_OnhandQty],
[PartBin].[BinNum] as [PartBin_BinNum],
[PartLot].[FirstRefDate] as [PartLot_FirstRefDate],
(substring(convert(varchar, PartLot.FirstRefDate, 12), 1, 4)) as [Calculated_date],
(count( PartBin.PartNum )) as [Calculated_count]
from Erp.PartBin as PartBin
inner join Erp.PartLot as PartLot on
PartLot.Company = PartBin.Company
and PartLot.PartNum = PartBin.PartNum
and PartLot.LotNum = PartBin.LotNum
where (PartBin.OnhandQty < 300 and PartBin.OnhandQty >= 100 and PartBin.WarehouseCode <> ‘SUPPLY’ and PartBin.LotNum like ‘%PF’ and PartBin.BinNum <> ‘INSP’)
order by PartLot.FirstRefDate
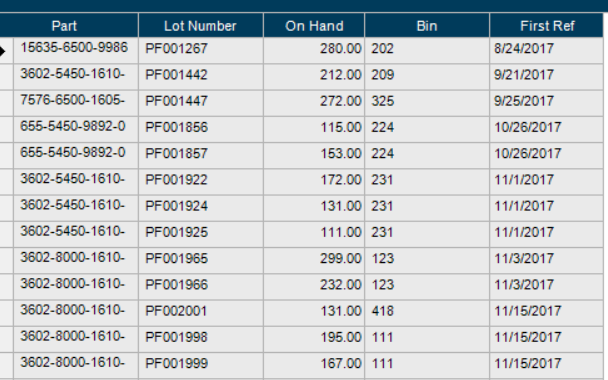
The query works fine for it’s purpose. I just got hung up trying to figure out this record count thing to use for the graph on the dashboard. Without the count the user gets:
which is usable for its purpose but I should be able to display that exact format in the graph.
select
[PartBin].[PartNum] as [PartBin_PartNum],
[PartBin].[LotNum] as [PartBin_LotNum],
[PartBin].[OnhandQty] as [PartBin_OnhandQty],
[PartBin].[BinNum] as [PartBin_BinNum],
[PartLot].[FirstRefDate] as [PartLot_FirstRefDate],
(substring(convert(varchar, PartLot.FirstRefDate, 12),1,4)) as [Calculated_Date]
from Erp.PartBin as PartBin
inner join Erp.PartLot as PartLot on
PartLot.Company = PartBin.Company
and PartLot.PartNum = PartBin.PartNum
and PartLot.LotNum = PartBin.LotNum
where (PartBin.OnhandQty < 300 and PartBin.OnhandQty >= 100 and PartBin.WarehouseCode <> ‘SUPPLY’ and PartBin.LotNum like ‘%PF’ and PartBin.BinNum <> ‘INSP’)
order by PartLot.FirstRefDate
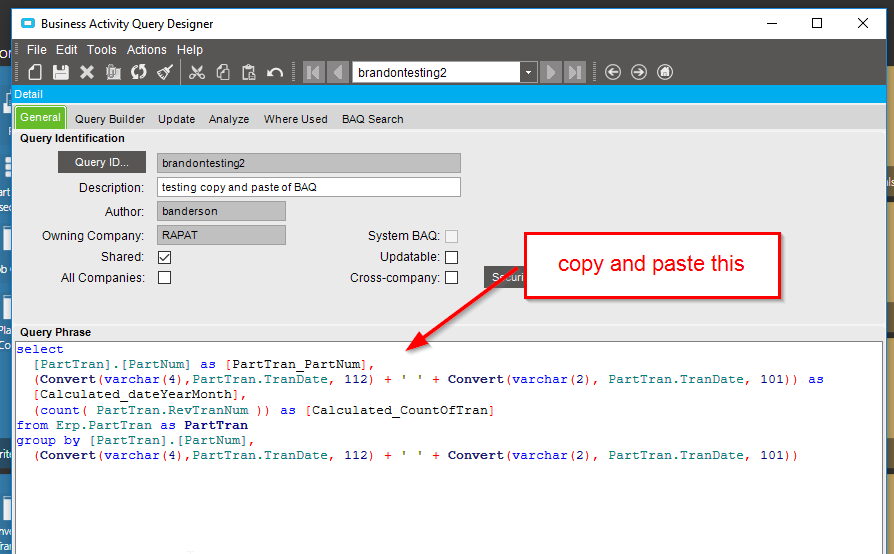
You will probably have to have a query to feed your graph (grouped and summed) and another to feed your grid. I don’t think you can do both in our query/grid. I’m doing some testing to see what I can figure out.

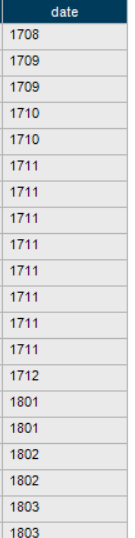
 record count thing to use for the graph on the dashboard. Without the count the user gets: