datadaddy
September 24, 2024, 4:51pm
1
Curious if anyone else has seen this, have been working on a dashboard that was converted over to Kinetic-Web and testing some changes that I made after.
Developer tools and ctrl-alt-8, ctrl-alt-9 (etc) were working fine, suddenly I can no longer active the logging to the console.
I’ve tried other dashboards, it works fine in those cases,
Looking for any ideas,
Thanks
1 Like
klincecum
September 24, 2024, 5:04pm
2
You try closing the browser and starting over?
datadaddy
September 24, 2024, 5:11pm
3
Yep, exited all of chrome, cleared cache, to no avail
Even tried MS-Edge, no luck,
1 Like
dcamlin
September 24, 2024, 5:24pm
4
You can type this into the console… CTRL-ALT-8 (I think) was the keyboard shortcut to do this.
epDebug.toggleMetaFxLogging
What did CTRL-ALT-9 do?
1 Like
datadaddy
September 24, 2024, 5:27pm
5
Awesome, that worked, anyone know the similiar for ctrl-alt-9 and ctrl-alt-v
dcamlin
September 24, 2024, 5:28pm
6
What did those commands do?
datadaddy
September 24, 2024, 5:29pm
7
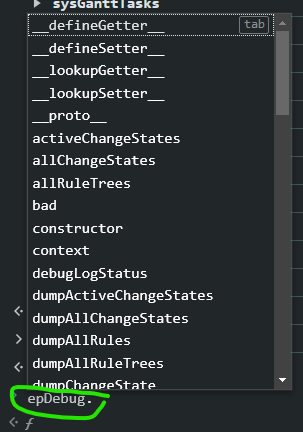
oh, I see just typing epDebug. in the console window shows context sensitive help, I think I can figure it out from there
ctrl-alt-v is to “show data views”
2 Likes
dcamlin
September 24, 2024, 5:31pm
8
epDebug.views
Not sure about the other.
datadaddy
September 24, 2024, 5:32pm
9
I found ctrl-alt-9 is epDebug.toggleCoreLogging
thanks !
1 Like
dcamlin
September 24, 2024, 5:32pm
10
If you start typing epDebug. into the console, a scrollable list appears of various options:
ALSO… if you use the same commands a lot… if you just put your cursor in the consol and hit the up arrow, it scrolls through recently used commands.
I don’t know the keyboard shortcuts because I typed them in once and now just use the arrow to toggle through to the one I want/need and hit “enter”.
2 Likes
