We have a daily production meeting where supervisors will take turns reading data from spreadsheets, which we are wanting to transfer to a bar chart through Data Discovery. We have the BAQ to return the correct data, it is now an issue of viewing it.
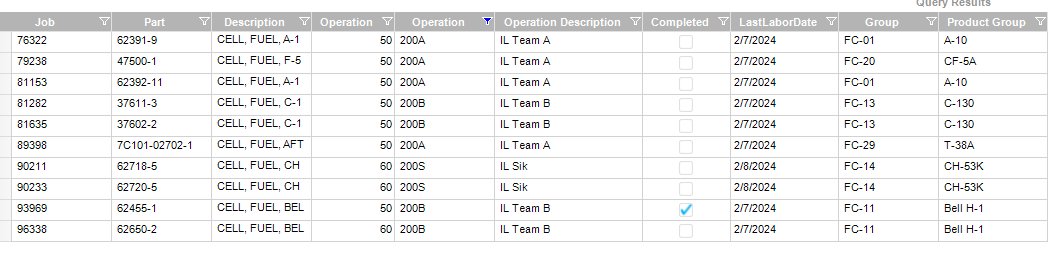
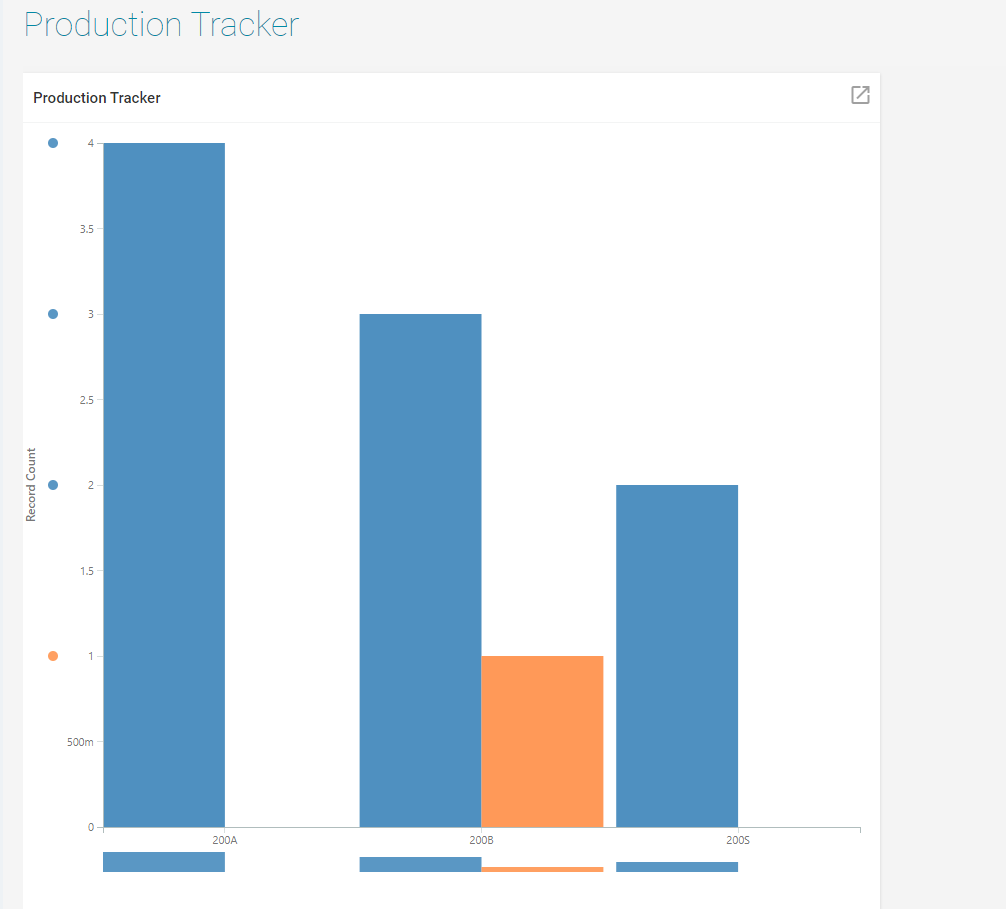
As seen above we have a BAQ returning 10 rows, each job has a different platform (group) as in the far right column. In our Data Discovery view seen below, we do receive all 10 rows. We are looking to expand this down to the platform (group) in our chart view as well. Is this possible?
Thanks in advance!