Definition of "common parts"

Where I work, we have, basically, a single product line that we sell, industrial trucks. They all basically look like this:
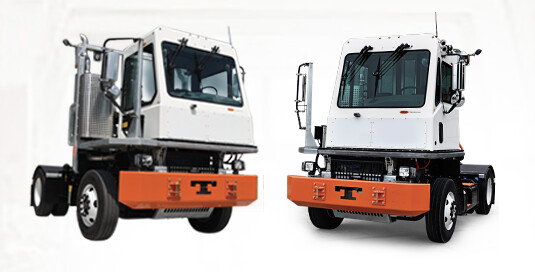
image

Now, in reality, there are two primary kinds – street-legal and not – and also, every truck is custom to an annoying degree (colors, heated mirrors, how many exterior lights, ad infinitum). The options are all a la carte (no real “packages”), so the combinations are endless (presuming they are physically possible).

You, the person that doesn’t work here, would probably never spot most of the differences between two customers’ trucks. But I would.

I get asked on occasion, “What parts are common?” And HOW common are they?

The biggest problem I have with that is how on earth do you define that?!

By the way, this is not an Epicor question. I’ll do this in Excel. And just assume that there is no logic as to how the BOMs are created. We don’t use Configurator yet and there’s no real “base model” to, um, base your calculations off of.

What I am asking is about comparing multiple (say 5) BOMs blindly - with no bias or logic as to why they should be alike or not. Just raw math.

Example:

image

How many parts are in every BOM?

  • 2

What percent of parts are in every BOM?

  • 2/5 = 40% (if a BOM is, on average, 5 parts)
  • Or 2/12 = 17% (if there are 12 different part numbers in all the BOMs)

What percent of parts are 80% common? (In 4 out of 5 BOMs on average)

  • 3/5 = 60%
  • Or 3/12 = 25%
  • But part V is pretty commonly used, too.
  • I have found that if you go down below that 80% number, you can actually end up with a percentage over 100! (I could explain, but let’s not…) So this can get to where you start lying to yourself.

Are there any standards on how to answer this question? Any functions from statistics class that would help?

============================

If you feel like throwing this in Excel:

BOM 1 BOM 2 BOM 3 BOM 4 BOM 5
Part A Part A Part A Part A Part A
Part B Part B Part B Part B Part B
Part C Part C Part C Part C Part M
Part J Part V Part V Part X Part V
Part K Part W Part Y
Part L Part Z

You can do it in excel. Basically you have to make a Distribution table with two columns Part and no of times it appears in BOMs, something like below

Part No of times

A 5

B 10

Based on this you can calculate how many parts are used in all BOMS etc.

Alternatively make a cross tab report and basically do a count of each column and row and sort.

These are some ideas I have.

So, I am not so much asking how to do a PivotTable, but more for opinions (or standards?) of what defines “common.” Just curious if others get asked for this.

Is “common” a part that is installed on literally every single thing that goes out the door? (Basically that’s only the windshield, the dashboard shell, some air manifolds, and various hardware.)

Or is it something that is “pretty common” – used on X% of trucks? and what is X?

This is very subjective. We have similar situation. Some materials account for 60% of our volume and are in use every single day. We cannot be out of them at any time, outages will be very costly in terms of machine downtime, scrap etc.

Then there are some materials that suppliers make only a couple of times a year, so again we have to stock them at all times although used only a few days in a month. I guess those are not common for them.

So, in a nutshell every industry and business will vary in their definition.

I would define common as anything used across more than one and “pretty common” go 80/20 maybe? I would say write a dashboard dumping the assemblies and materials to count how many there are sort top to bottom on count and there’s your most common to least common. What’s the overall objective? To identify what should or shouldn’t be stocked or pre-fabbed?

PS Sexy looking pups you got there!

Ha, yeah I’m not sure myself. I think the point is to blame someone for “Why did we run out of this part?! It’s a common part!” So I guess it’s sort of that idea of stocked or not.

@Vinaykamboj you make a good point about “kind of common” but still critical.

I feel like it’s to debunk or validate the myth vs. data-backed reality. Of course, you can make data say whatever you want it to say. Just increase or decrease the sample size and cherry-pick the subjects.

This is what I did a year ago. The answer is somewhere between 46% and… 100.4%.

Sample size is 697 trucks on 130 configurations; I analyzed about 1.2 million JobMtl rows at the time.

Ah that’s another twist. I went by % of trucks sold not % of configurations (makes it a weighted average, basically).

Statistics.

image