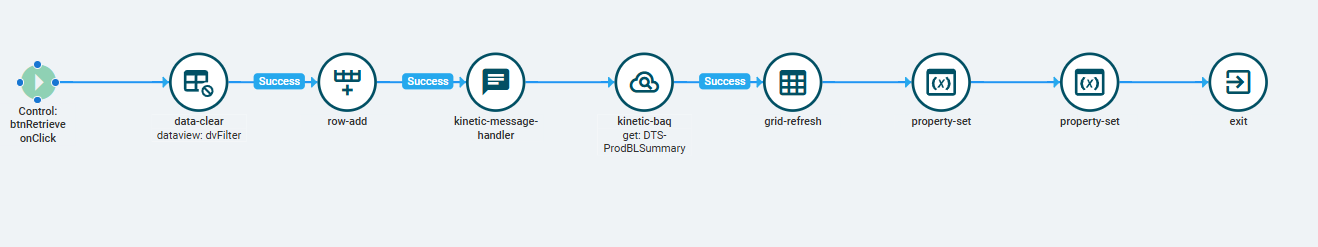
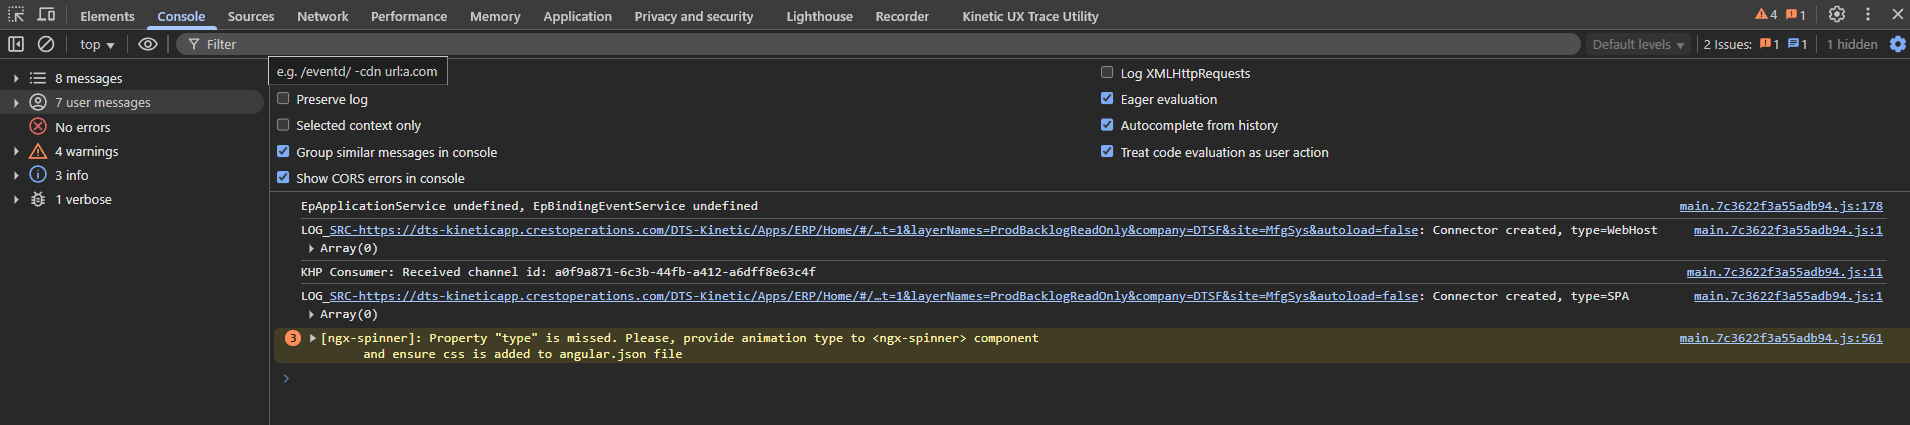
Looking for some help with DevTools trying to debug Application Studio events. I apologize in advance but I am not sure what the names of the items that showed up in DevTools/Console are. The first few times I opened DevTools there were green lines that corresponded to the Actions in my button click event.
If you click anywhere on the kinetic window (not in the debug section) and hit CTRL+ALT+8 it toggles on the debug logging and then you should see all of the events firing.
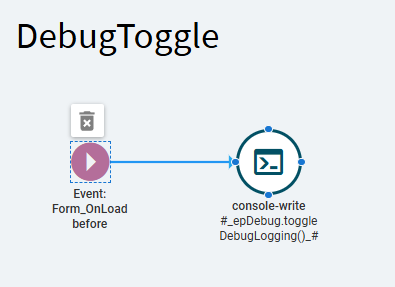
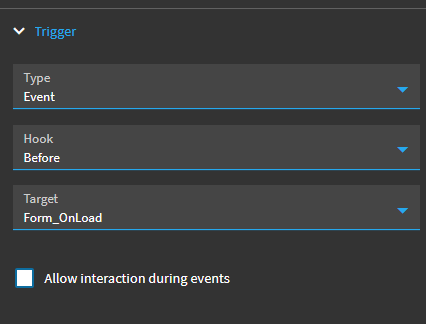
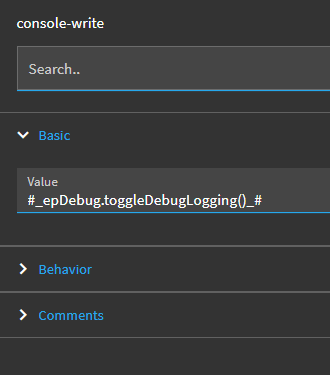
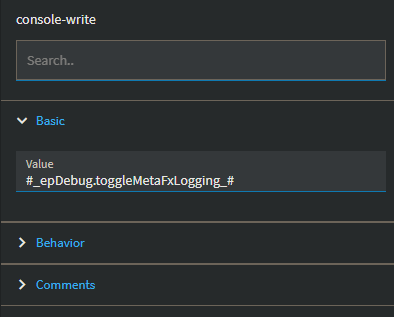
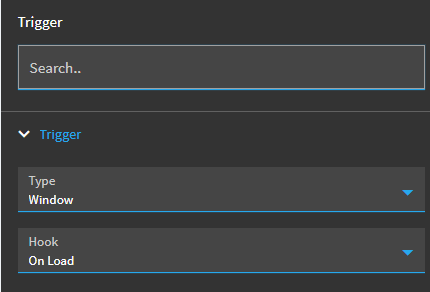
If you want the page to always load with debugging enabled (like while you’re developing a new layer) you can use this to set it automatically.
Just double checked the one I have set up this way and I have a different debug command. I also have my event on Window OnLoad but your trigger should also work.
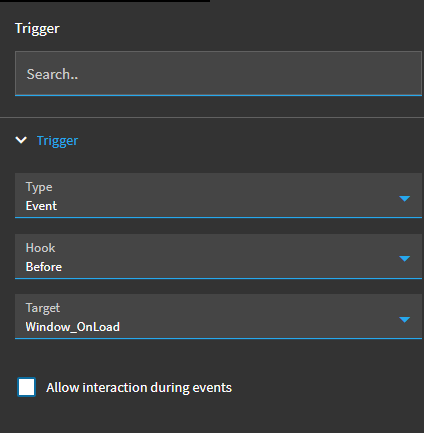
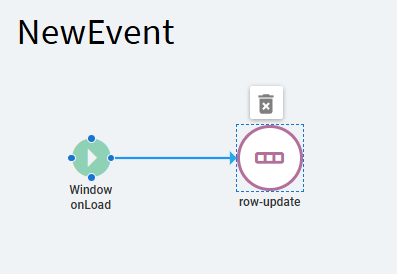
Mine was on a custom dashboard, so I made the Window_OnLoad event and just put it there. I’d guess you’d need to do it after instead of before because you need the window to be there before you can change the logging setting for the window.
I am still struggling with the Debug. I am sure you have made some classic customizations and had Visual Studio fire up to debug the code. Is there any way to make DevTools open before the Preview so you can see what is happening when the Preview Window loads, i.e. the step where Visual Studio stops and waits for the Continue to be pressed?
I’m new enough to kinetic that I’ve never done a classic customization, I started in the browser UI and only open the client for functions (Some BPMs and BAQs early on before they were available in the browser.
You don’t necessarily need to have the dev tools open when the window loads. If the event is working, it will start writing all of the event details to the console in the dev tools and when you open it a second or two later, you’ll be able to see everything after the window_OnLoad event.
Is there a particular event that’s not working that you can’t troubleshoot?
I found a few things I did wrong when I created the app and I am going to do it over with this “knowledge”
Application Studio is so Quirky. Not sure if you are old enough to remember the original Saturday Night Live cast’s nickname “Not Ready For Prime Time Players”, that is what I call this Application Studio. Too many bugs.
Thanks for your help. I am sure I will be posting again.