We are in an private cloud setup and we had Epicor talking with sql at 2500ms on Friday. Since Monday it’s been between 5700-8800ms. We’ve tried increasing our IOPS but that didn’t help much. Any other options some if you have tried?
I’d be interested to hear other people’s times. We are on-prem.
I’m sure you checked/ruled out, but have you tested your performance to and through your ISP to ensure you have no resolution problems or other related issues there?
Yes, those are excellent. Was the first thing I checked.
Is the appserver on the same machine as SQL? People will disagree with this, but you will absolutely get better performance if it is on the same box.
If you have them split and don’t want to consider combing, check the network latency between App and DB. If ping is over like 3ms I would say that’s your problem (there is a ton of chatter between App and DB). You can probably get this down by looking at Azure accelerated networking and Azure Proximity groups… the idea is to get the machines as “close” as possible.
We are a private cloud setup and they are on two different vm servers. Using Azure. Checking the ping between the two.
The amount of Memory used by the application pool is always my first port of call. If it is running high (approx above 7gb) then you will start seeing slowness. That’s been my experience.
We are on prem with separate virtual servers for app and db on same host, so inter server ping is minimal, and client ping in this office is if the order of 1ms. And on 2023.1
But certain operations seem very slow- eg adding parts to large boms, add many lines to a PO. Staff report up to 20 sec delay between adding a line and system being ready to accept the next.
I saw this importing PO lines via DMT also: if the PO had around a hundred lines or more the DMT would absolutely crawl, dropping from multiple lines a second to multiple minutes per line. It felt like some exponential dependency on the line count, as if to add each line it would read or write the entire PO.
The problem is worse for our USA staff as the servers are here in New Zealand and their web clients have around 190ms ping latency to them.
I did find the browser to be much faster for them than the Kinetic Client, just not nearly as fast as we would like!
Would welcome others’ thoughts.
Chris
Do you have SQL index maintenance plans in place?
I don’t even know what that is… But I’ve been tracing it further using devtools. On a PO with 138 lines, changing the price on a single line takes a bit over 4 minutes (!). That’s very repeatable.
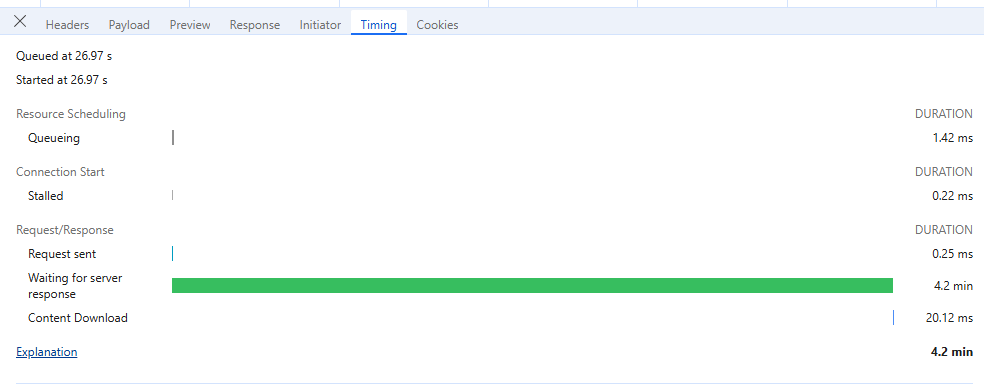
This is the problem call, taking 4.2 minutes to return- (so at least we know problem is server, side not client/server)
https://ourServer/erp11live/api/v1/Erp.BO.POSvc/Update
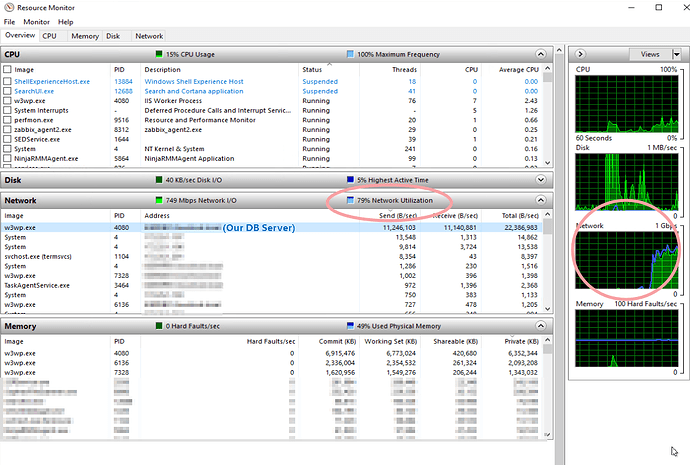
While its running I looked at resource montior on our app server, this shot taken seconds after the update started- network shoots up close to 100% and stays there the full 4 minutes of the UPDATE call, traffic between app server and DB server.
Seems like a bug, have logged a case. But for my own sanity, I’d like to know what to look for on the app server while its happening to see what the heck its doing!
I think you’re right, but I’d do the trace from a browser on the app server to confirm.
Index maintenance (scheduled jobs that rebuild fragmented indexes in the database) is a very important piece of Epicor db tuning. You can find a lot of info on this site, also Ola Hellengren is where most people start:
When different operations in Epicor have different performance levels (e.g. Purchase orders are slow but sales orders aren’t), or when things get way worse with many lines, that often points to fragmented indexes.
That said, 4 minutes feels too extreme to me to just be fragmentation. I am not a network guy but could you have a bandwidth issue between the app and db?
Also recommended running the Performance and Diagnostic tool if you haven’t already.

