Anyone using Epicor GROW BI? Looking for a reference … what do you like, what don’t you like?
Hi Terry,
I loved your presentation on how to get our dashboards to Kinetic - thank you!
While we are not Grow users, I thought I’d make a minor comment since I don’t see you getting any answers yet… I recall at insights I noticed that Grow did not allow cross updating of visualizations like PowerBI does. I asked the presenter and he confirmed that one needed to select filters for each one to get the data viz update.
We have worked a good bit with PowerBI over the past year and this dynamic cross updating of the visualizations has been a very important factor for allowing analysis as desired. I would look into whether Grow actually is able to do this similarly.
Nancy
Thank you, Nancy. I’m glad our presentation was helpful.
Just to be sure I’m understanding the issue with Grow, are you referring to dynamically updating filters? So if I have a dashboard with several graphs/visualizations, I can’t adjust them all at once but have to change the filter for each one separately?
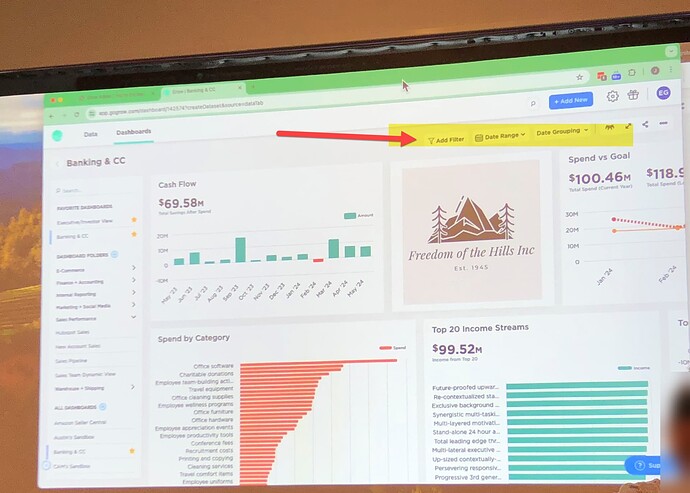
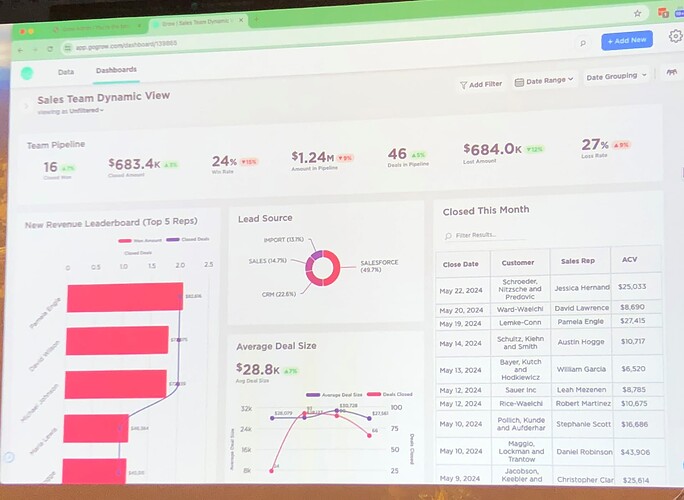
My recollection Terry is that the report visualizations did not cross update when you click on another visualization. I found some of my pix from the presentation and here are a few, in case it is helpful. (Note, If anyone else out there notes that I am wrong on what I suspect with my notes below, please feel free to offer additional info)
In this first Grow graphic I do not think you can click on a bar in “spend by Category” and see the other visualizations on the page update for the selected bar.
In the second Grow graphic I don’t think you can select Lead source “CRM” and see the other visualizations update for the selection of lead source.
Have you worked with the Power BI visualizations at all? I find them very helpful when the visualizations work to do cross updating. Let me know if you need me to provide an example to show what I mean.
Nancy
Thank you, Nancy. I will ask them about this.
Trudy

