Hi everyone,
I’m in the process of uplifting my company’s custom part tracker to the latest version of Epicor Kinetic, and I’m looking for some guidance.
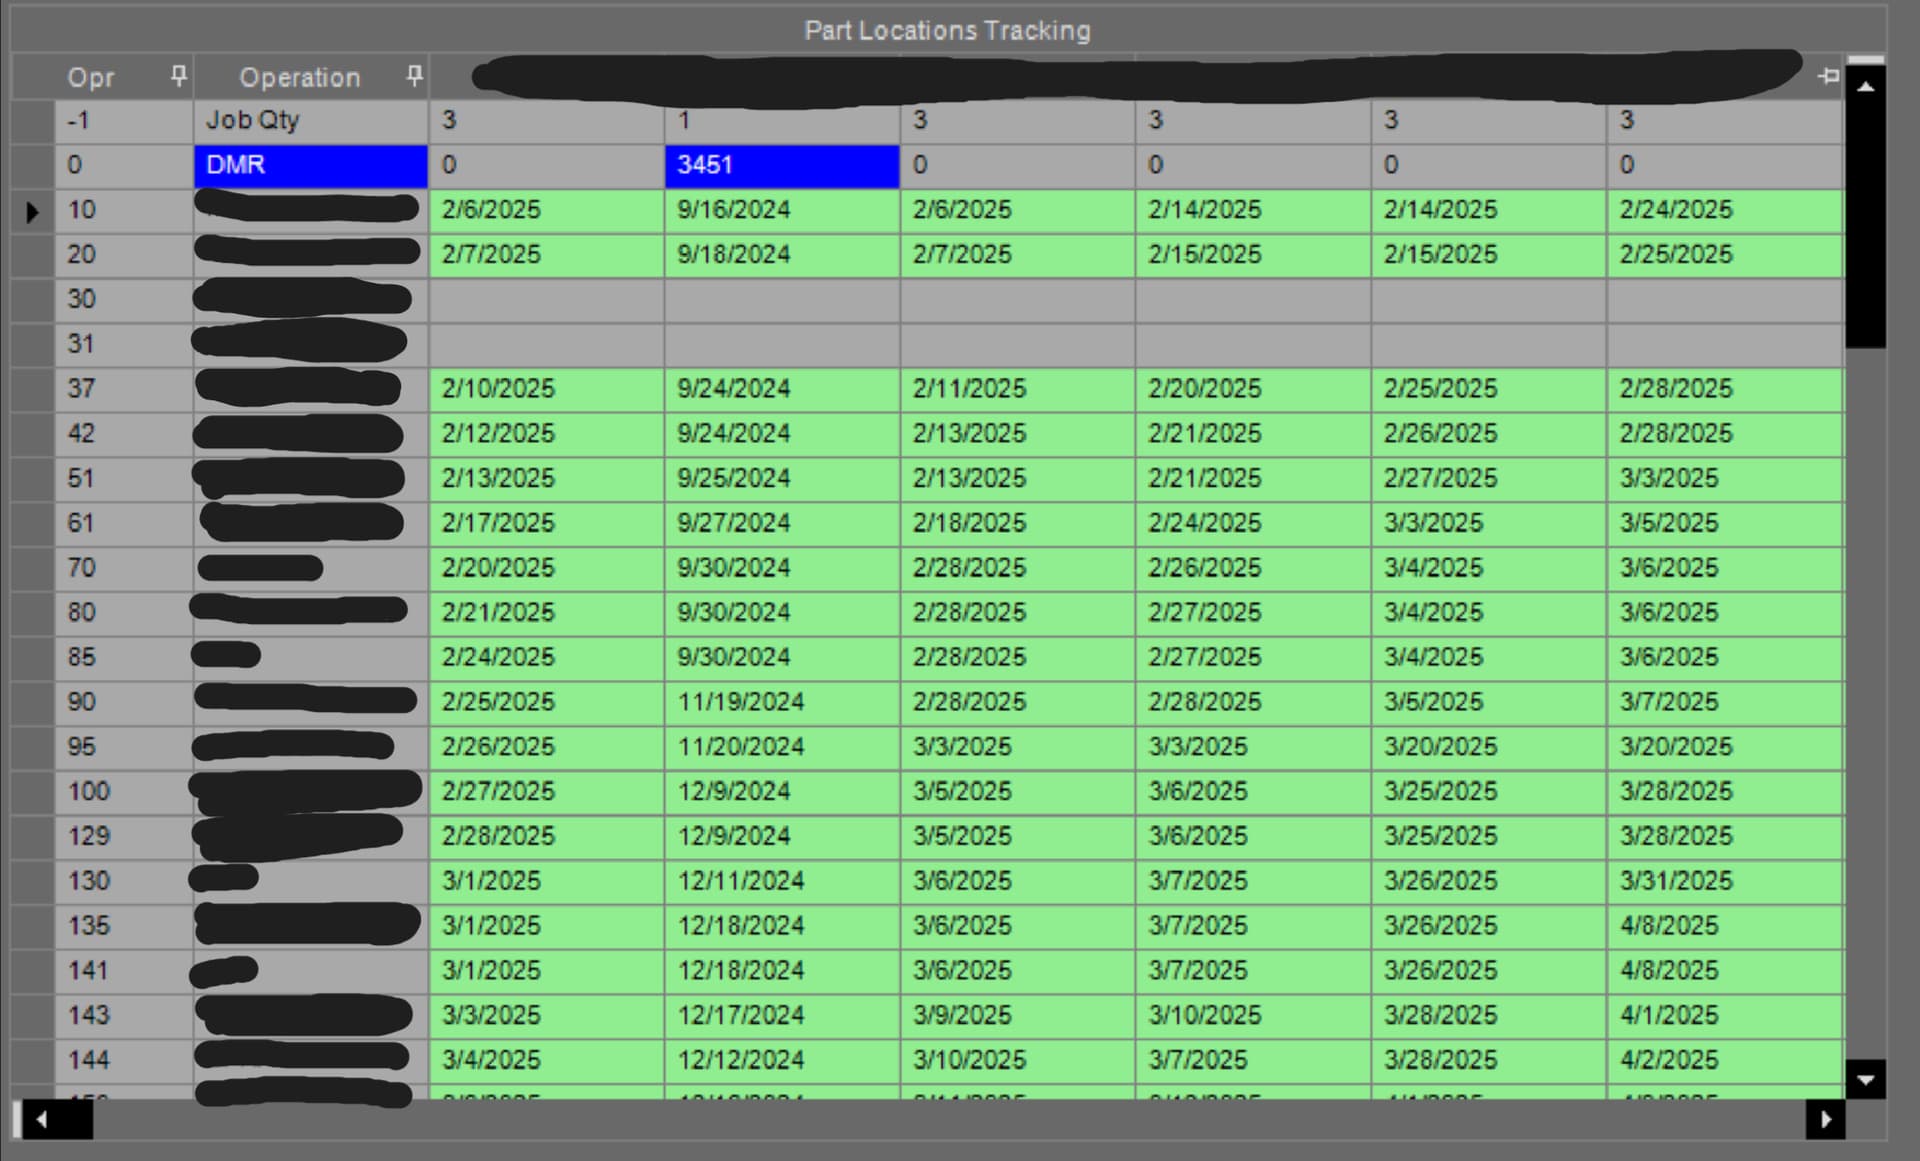
The current tracker is set up in a way where each column represents a unit of a specific part, and each row represents an operation that the part moves through on the shop floor. At the intersection of each row and column, we display the predicted date of completion for that operation. As the part moves through the process, the actual completion date is tracked. Once the operation is complete, that cell is highlighted in green to visually show progress.
I’ve already built two BAQs to pull in all the necessary data, and now I’m trying to figure out how to best replicate this grid layout in the Kinetic environment. Specifically, I need help with how to build a grid or matrix-style display that allows for this level of dynamic data presentation and conditional formatting. I’ve attached a screenshot (with sensitive data redacted) to give a better idea of what I’m trying to achieve.
Any advice on building this type of grid in Application Studio, how to bind the data effectively, or how to implement the formatting logic would be greatly appreciated.
Thanks in advance!