We use FIFO and when we run the Inventory/WIP Reconciliation report sometimes it gives us the error “The transaction will result in negative FIFO onhand quantity.” So I figured I could look in the trace file and see where this error is actually happening; which I hoped would point me to a specific part where the error is occurring… But I do not see anything like that in the file.
Caleb, a few pointers -
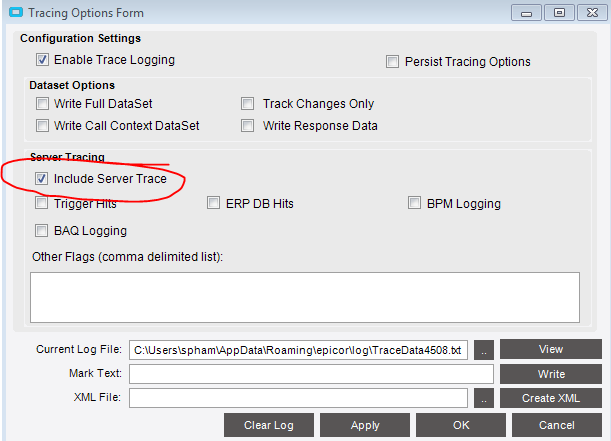
First, always clear your log right before you begin tracing. There is a lot of data captured so this helps narrow it down.
Next, I’d use a special viewer to work with the XML tags. I like notepad++. If you tell it that your doc is XML you can actually collapse records. It makes it much easier to navigate and then drill down.
As far as your specific problem - I’m not sure, I wouldn’t expect that it is making any transactions.
First, try to shutdown the System Monitor before you enable tracing. Second, ready the entry screen for the transaction prior to enabling the trace. These two steps will reduce the size of the log file. Look for Methods, Datasets, and fields value before and after they were entered. If you’re looking to enable a BPM then you need to identify and understand which method is being called.
I use either PDT or notepad++/Visual Code as a raw XML reader.
Agree with the other topics on trimming what you are capturing. I usually include server trace and set some flags to see what’s going on in the server for this operation.
I’ll try Notepad ++ and trimming the log file down to the issue only so it’s easier to read.
Thank you all.
Edit - So it looks like these files are kind of useless for what I wanted to track… There’s no info in there that shows anything about the report failing, it just displays the report parameters and what not.
Yes, I think tracing is for figuring out how things work.
For troubleshooting errors you could try looking at the report details in the system monitor, or your server log?
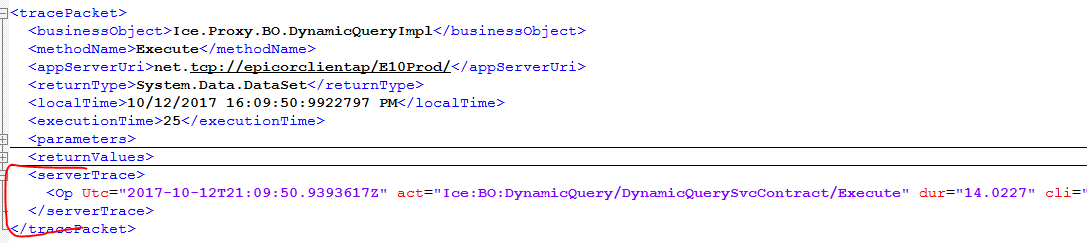
This is the same trace information as if you went to appserver.config and enable a trace manually (or checked the box for the most common traces via Admin Console).
The difference with entering it in the client Tracing Options Form is that the trace will be of server activity JUST FOR THIS USER. So the client makes a server call, the operation hits a service, a few internal libs, BPMs, the database… all that will be returned in that serverTrace node based upon what flags are set.
For example, I enabled the sqltext in the client and received the details of which SQLCommands were executed based on the logic for this user.
I’ve had a lot of luck using XML Notepad 2007 to analyze trace logs with a lot of success. It’s a free Microsoft download if you are interested. Here is a link to the Wiki for reference.