For the method directives, you can see the data going into, and out of the method
directives being called. Anything else you’ll either have to find a log for (if it’s logged),
or log it yourself.
For data directives, as far as I know, unless it’s buried in a log somewhere, you are
on your own.
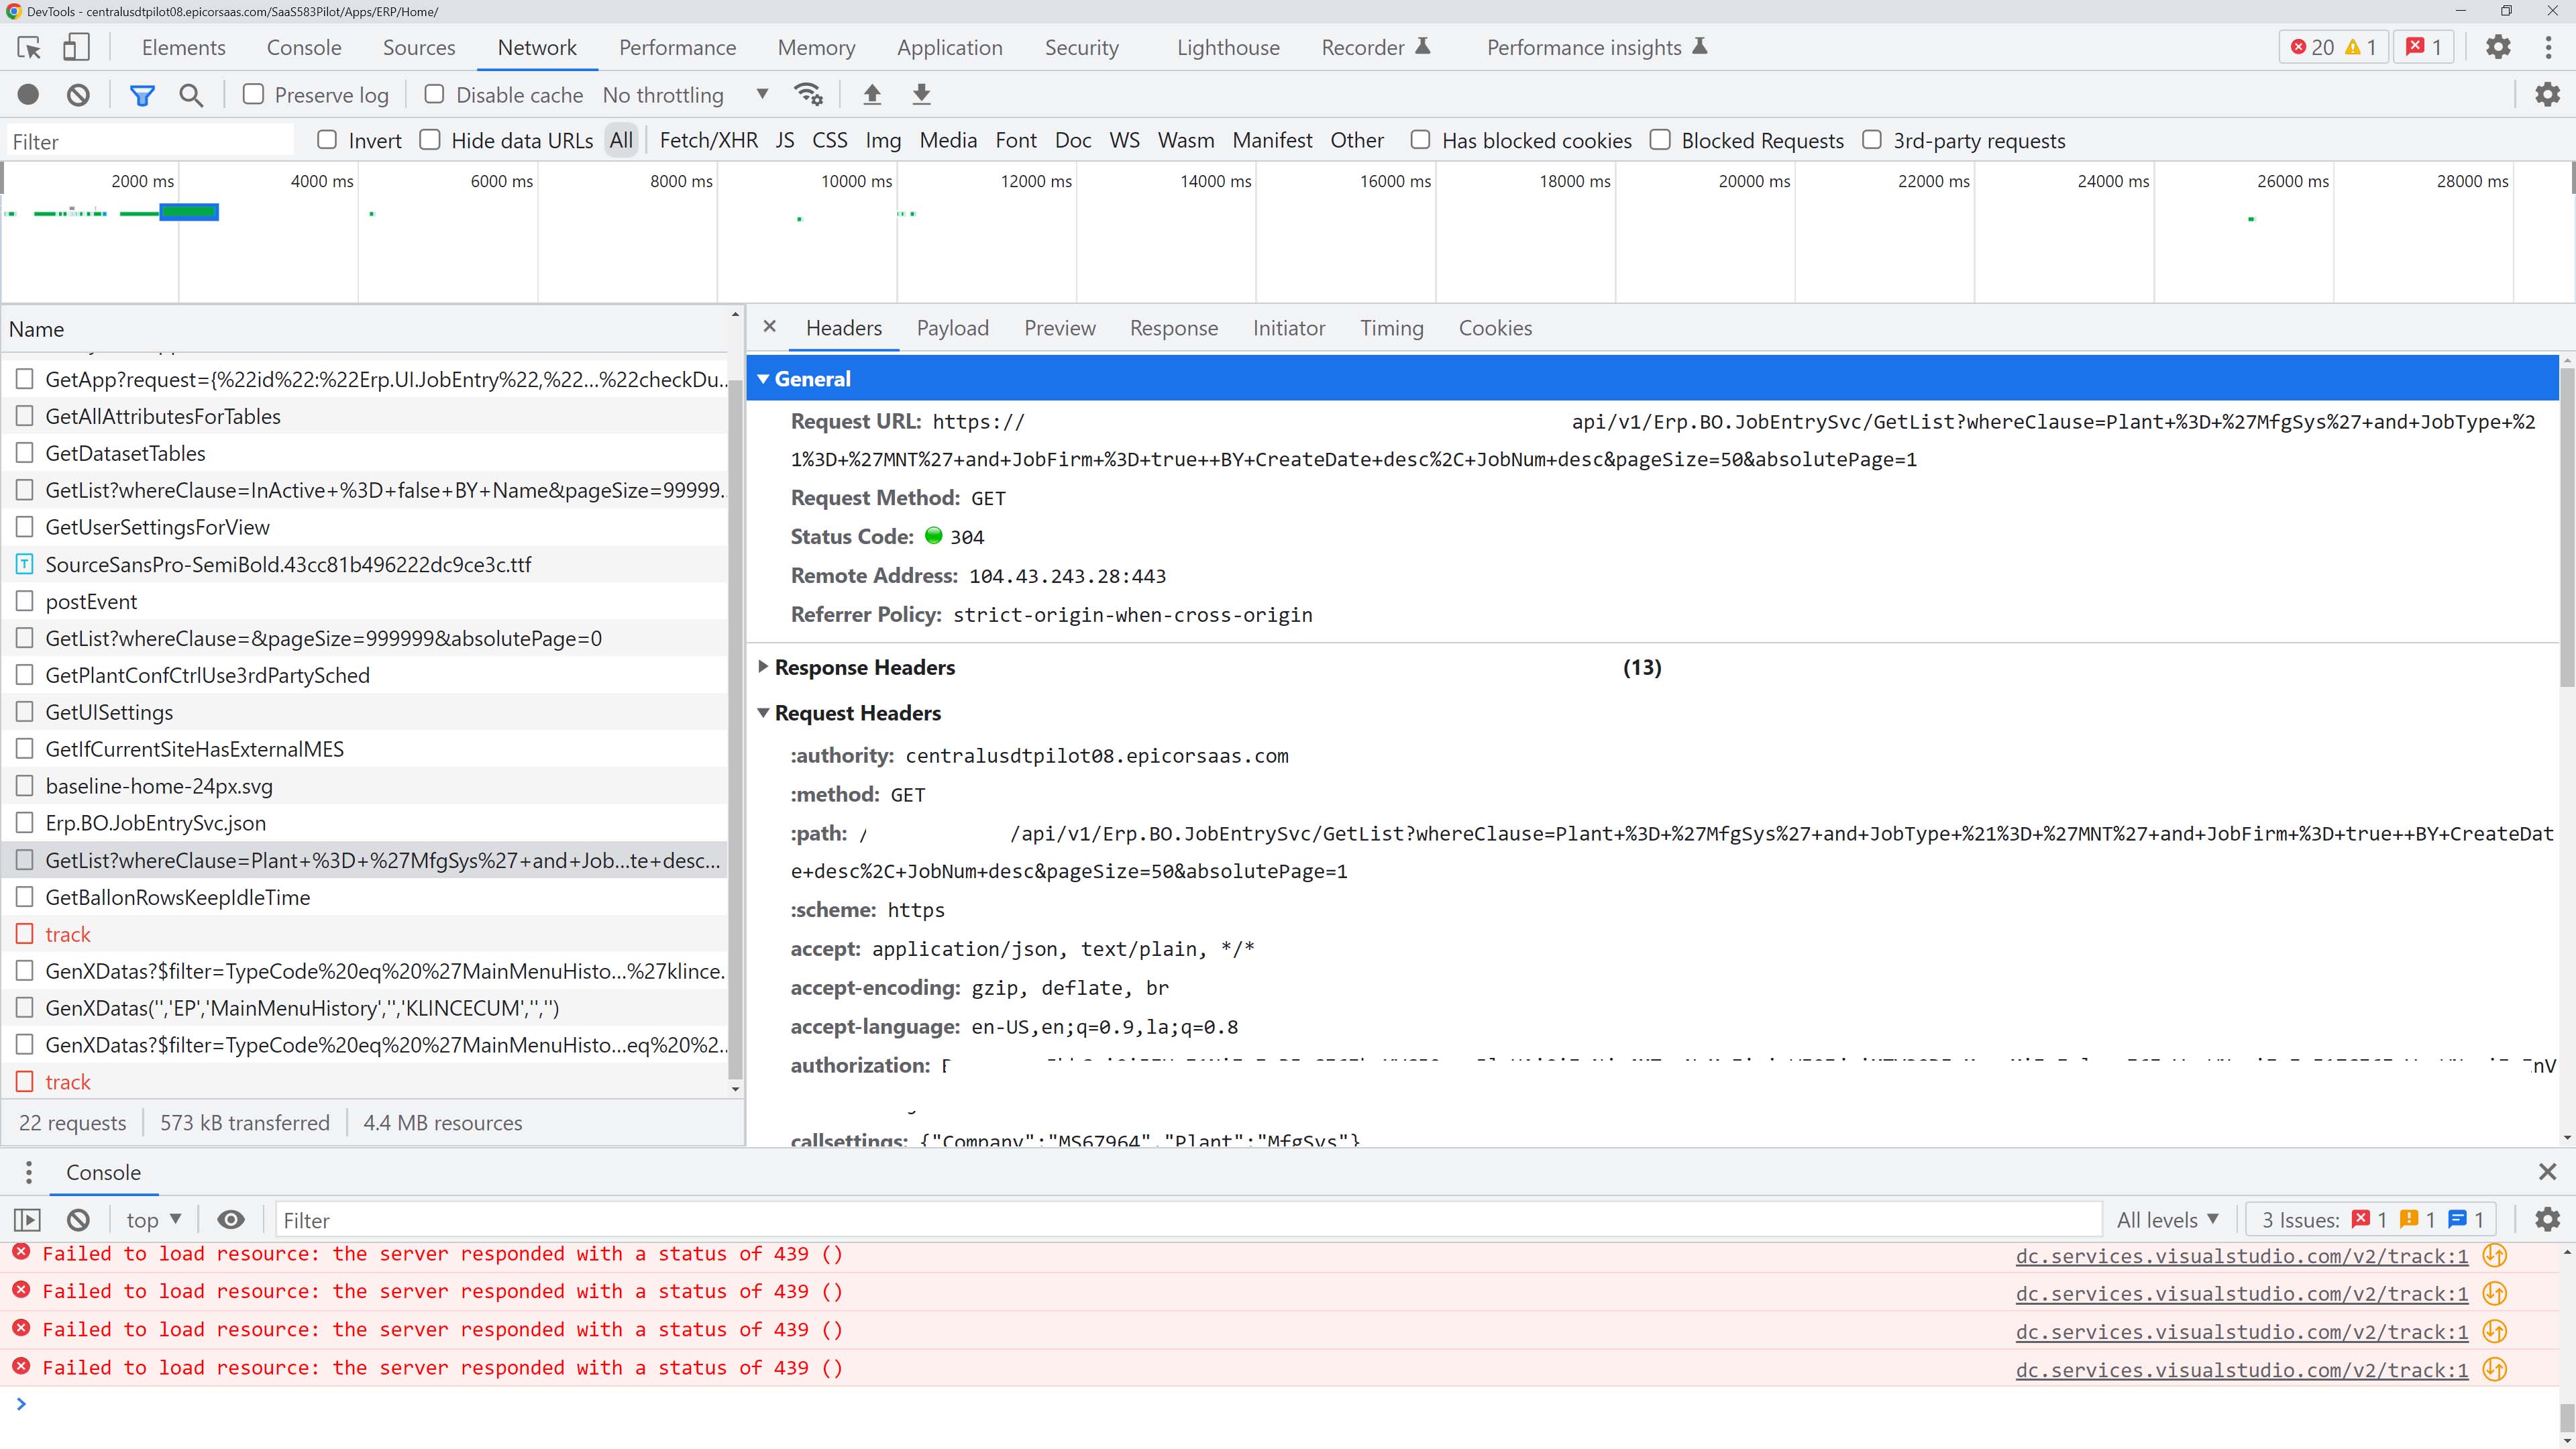
ok, yeah, I was seeing that, however I did not see the “payload” and “response” tabs,
those make the input and output of the METHOD more clear
you had said:
“For the method directives, you can see the data going into, and out of the method
directives being called. Anything else you’ll either have to find a log for (if it’s logged),
or log it yourself.”
But isn’t it really a combination data going into and out of both the Method call and the combination of all directives attached to that method ?
I was really liking the info F12 was providing for the events and REST calls, so I guess I came expect it would also show the directive’s details, that’s kind of a bummer…maybe in the future
Hello @hmwillett i am trying to convert handheld menu forms in kinetic app. Is there any way to trigger an button click with the help of shortcut keys on keyboard like F1, F2, Esc, etc…