Does anyone have their app pools recycling on a regular basis using IIS App Pool > Advanced Settings> Recycling settings?
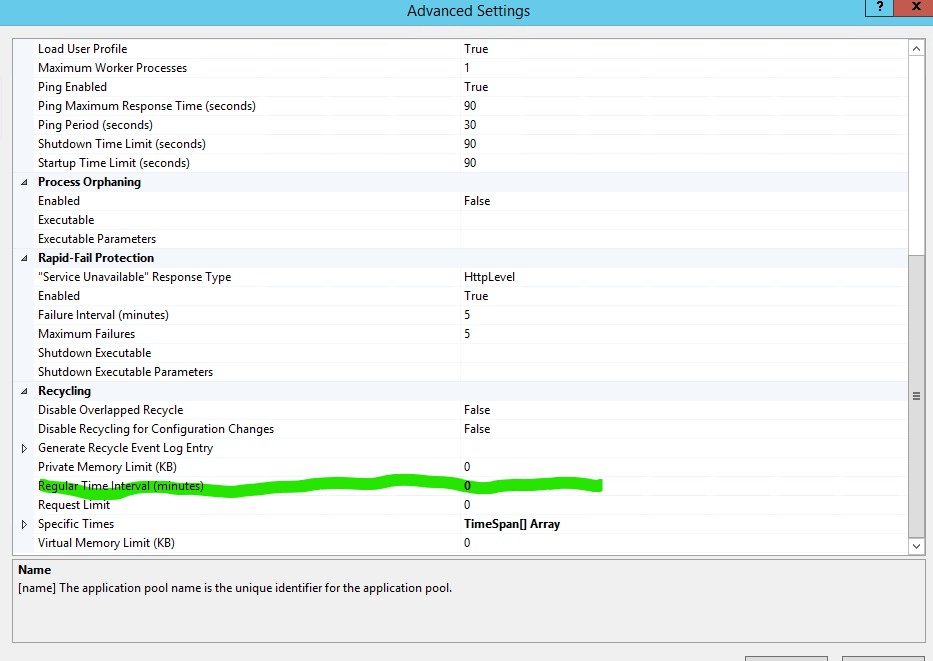
We were having issues with RAM on our app server because some of our environments’ iis processes were consuming more and more memory over the course of a week. When we looked into it, all of our iis app pools (set up by Epicor) have no “regular time” interval set for recycling. There were also no schedules set to recycle the app pool.
Is that standard practice for epicor? We are starting to recycle at a specific time to avoid this issue. We were also thinking about increasing RAM, but we are starting with recycling on a regular basis.
We already did our due diligence by looking for memory leaks. We believe this is normal consumption of memory based on all of the digging we did.
32GB. We have 5 app pools running there though. Two are copies of our production environment running all the same scheduled tasks as live (regen MRP, regen PO suggestions, global scheduling, etc.). We don’t see any of them running away or bombing out and consuming a ton of memory. The testing environments sometimes get up to 6-8GB of RAM usage while our production gets to 11. At that point we start recycling the test environments which resolves the issue.
We’ve got 25 app pools with 60GB of RAM. I know that Epicor tends to use anywhere from 60% - 85% of memory pretty consistently. But we’ve not noticed any delays in ERP. Most of the app pools, probably 1/2, are set to always running.
That’s when our app pools are recycled if they ever are. We have a maintenance window on Sundays. So often, they get recycled then. But nothing scheduled. So it’s not every week they get recycled.
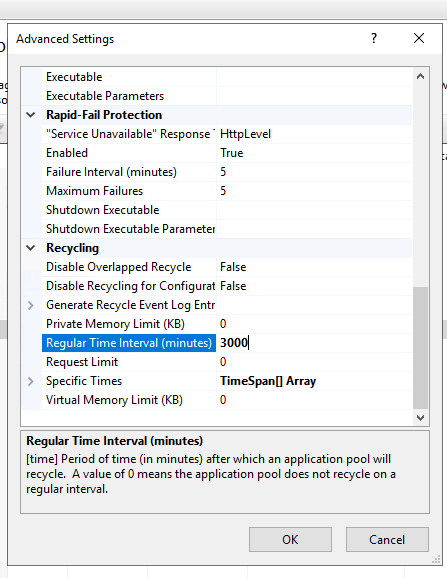
i have noticed some strange issues, due to this Epicor RAM utilizing, so i have set it to two days after seeing your post, let see the effects of this setting. Note: Our server RAM size 128GB
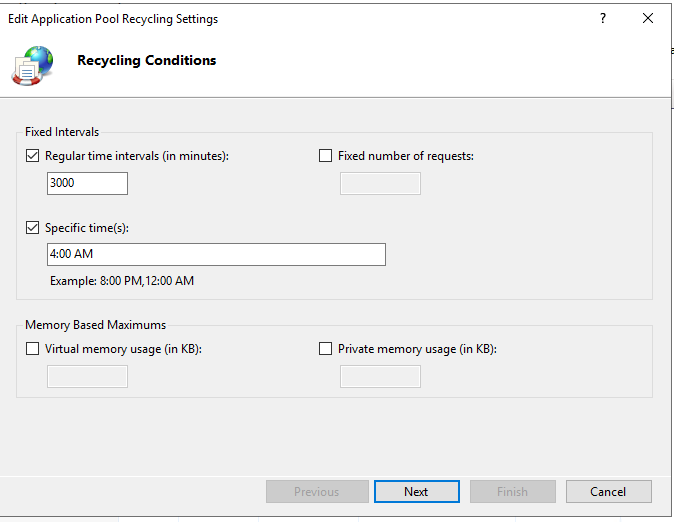
Nice, I would like to note that you are using the time interval which starts once an app pool is recycled. In other words it isn’t a set time that it would recycle, just a set interval. You can use the specific times, which it looks like you did as well, to specify the exact time you would like it to recycle to avoid interrupting any important processes.
We set ours up on our production environment last night and didn’t see any issues this morning. It worked as expected.
no i did not use the specific times array, just did it manually and expecting the IIS manager to run the recycle process after this interval, do I need to set/schedule the task some where ?, and any idea, where can i find the last IIS recycle time / info ?
@jdewitt6029 may be able to help with this, but I’m sure there is some way to find out the last time it was recycled. In any case, that is why we didn’t do an interval because we weren’t sure when our servers would restart and then at what time that recycle would end up at. For example we may have to restart the server at 12 noon today and say our interval was set at 360 minutes… That would mean that after the app pool started back up at noon, 360 minutes later a recycle command would be issued. This would take place at 6PM which could interrupt some of our scheduled tasks.
In short, to avoid any timing issues like the example above, we set a time using the “REcycling” settings on the app pool which you can get to by going to IIS manager and right clicking the app pool you would like to modify:
There is no need for a scheduled task or anything like that.
There are several previous conversations on this a few year old but there is a ton of misunderstanding of the App Pool and ERP server behavior in general so a few of my favorite topics…
Caching
ERP 10 Server Caches Data. A Lot. More every release. It’s one of the reasons we heavily discourage straight to the db updating and prefer you use BO Methods. There is a cache invalidation system that is tapped into the standard BO Updates so straight SQL will bypass the caching and can cause lots of (not) entertaining side effects.
After a recycle, as each service is called over a few days, a new chunk of memory gets cached. It could be a query structure, it could be actual data such as the list of Users in a system. The point being is that you will see memory grow over time and that is fine.
‘Memory Leaks’
There can be real memory leaks - both in shipping code as well as in BPMs, functions and the like. In normal usage, these will get cleaned up at the end of a server call. All server objects are cataloged and we iterate through to ensure no one has done something bad. The Disposable trace will note that for you
An example of this scenario is as follows. An warning that the framework cleaned up an undisposed class after the previous operation.
This handles most scenarios fine EXCEPT - long running tasks.
Something that runs a LONG time - maybe MRP - can have a memory leak that can bring a server to it’s knees to finish the task. At the end of that process, the framework cleans up all the loose objects and everything springs back to life happily (Until the next time the task is executed).
I have many chats with customers and partners that have made mistakes in BPMs and this trace has helped them identify issues in their efforts.
And yes, if you see any of these scenarios in the wild without BPMs - log it! We go through and clean these mistakes up from time to time as we find them.
App Pool Settings
There are a lot of settings in the IIS App Pool you should walk through and understand. There are numerous options to fit what how you want to have your server behave. There is no one size fits all. Everyone has different needs so spend a little time understanding how IIS behaves so you can apply your preferences onto your system. I’ll call out a few I get into a lot of conversations about.
Generate Log Entry
YES - PLEASE. LOG ALL THE THINGS. #KnowledgeIsPower
ShutDown Time Limit
I assume everyone has been looking at w3wp.exe for some time. When you recycle the app pool, you start a second w3wp and send all new server calls to the new version. The old one sticks around for a while to finish the calls it is handling. Most server calls will fit into the default 90 seconds but what about long Tasks and Queries? MRP running for an hour or more that gets blasted and have to start over. Users get cranky about that for obvious reasons. It’s not unusual to see people allow for hours to trickle down those long running tasks on their task processing servers. This allows for a more stable switch over to the process but does keep memory reserved for a longer time frame. #TradeOffs
If everything finishes in 3 seconds, everyone flips over in that 3 seconds. If it take longer to finish the effort, you run with 2 instances until the time limit or it is done.
I hope this kind of helps. This is one area where grabbing your handy IIS 101 docs are a good investment.
@Bart_Elia thank you for your input. It is valuable and much appreciated! We set up the trace flag for the disposable objects already and noticed that it was cleaning them up. Is a warning something we should be concerned about in this case? I remember a distinction being made on another post about a warning and an error in the server logs.
As mentioned above, for most User interactive processes not a concern. I would monitor closely anything around long running tasks.
You are always welcome to log any occurrence of the warnings. Many of them are data specific - based on a status changing from x to y, call a different internal library. That call not being done correctly can cause a delay in disposing memory.
The simple patterns have hopefully been cleaned up. There were many areas in codein the early E10 days not using an ‘Using’ block to auto dispose the memory when calling another library. These days I still see a lot of BPM code mistakes like:
var service = Ice.Assemblies.ServiceRenderer.GetService<Erp.Contracts.SomeSvcContract>(Db);
instead of:
using (var service = Ice.Assemblies.ServiceRenderer.GetService<Erp.Contracts.SomeSvcContract>(Db))
{
service.DoStuff();
…
If you can reproduce the data that triggers the delay in memory collection would be appreciated.