I recently tried diving back into Kinetic. I opened the browser (Edge) and opened a dashboard that I built from a BAQ. I deployed it through application studio, and added to to the menu with menu maintenance. The BAQ shows estimated and actual setup times by resource group. The Dashboard should have the ability to quickly group and summarize the columns I want. This simple task is too complicated, buggy, and slow to be something we are going to have to use next year. Yes, I can show the grouping and filters. I can drag column up to the grouping header. I can even force this to happen when I deploy the dashboard. But the data pulled during this is terrible. The dashboard requires two or more manual refreshes to make it populate that actual data. And god forbid the data extends off the screen and we have to scroll down. That causes all kinds of epilepsy-inducing flashing and loading of data. If you are lucky you can grab the tiny scroll bar and force it to go smoothly down the list… If you’re lucky. Most of the time you can’t tell how long the list really is, how many records there are, or how to get to a particular record in the list. Is it too much to ask that the grids behave normally? All together this simple dashboard should not cause these kinds of headaches. At the very least figure out what the heck is causing the data to load so slowly and inconsistently. Then consider that if you’re going to lock up the browser for minutes at a time, at least give the use some feedback to say, “hey this is gonna taka hot minute, why don’t you go look for an ERP replacement?”
/rant
Edit: And don’t get me started on the column summaries. You seriously can’t just setup summaries for some columns? And you have to scroll to the bottom of the screen to see the sums?
We’re having the same issues. Extremely frustrating. Our Case has been attached to PRB0268342. Talked to a few people at Insights to get it in front of them, currently have an email out with two developers and our CAM in hopes that we can get some of our issues resolved, this included.
Not that it will help, but try that same DB on an iPad in Mobile View. Bet it will be fast. That’s what we’re seeing at least, and tried to convey it to show 'hey you’ve got it working here, get it working in desktop view".
We have tons of little issues in Kinetic which made us pause the roll out. Good luck on your side.
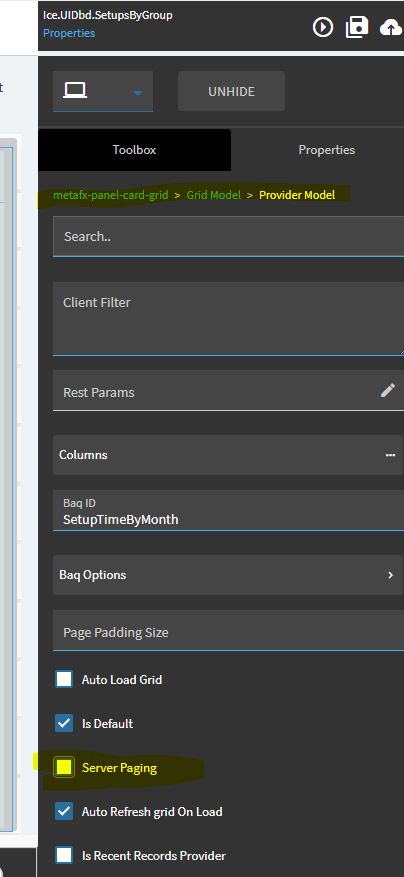
Have you tried turning off Server Paging in the Data Provider (I am pretty sure that is where it lives), in 2024.1 filtering is pretty buggy unless you have that turned off or have clicked on the arrow to download more records (to the point that some columns will not even show up as filterable until you have clicked the arrow).
I’ll try turning that off to see if it helps, thanks. Got an Inventory DB that consistently has these issues, will report back if there are any changes.
What is this and where is it? If this setting makes Kinetic run better, why wouldn’t they set it as default? I’m willing to try it out if I can find it.
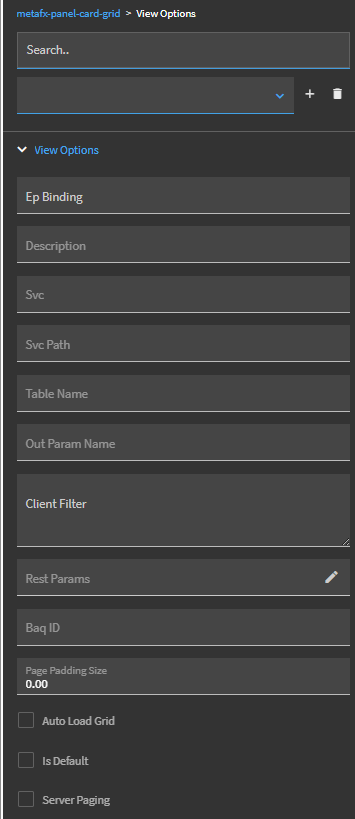
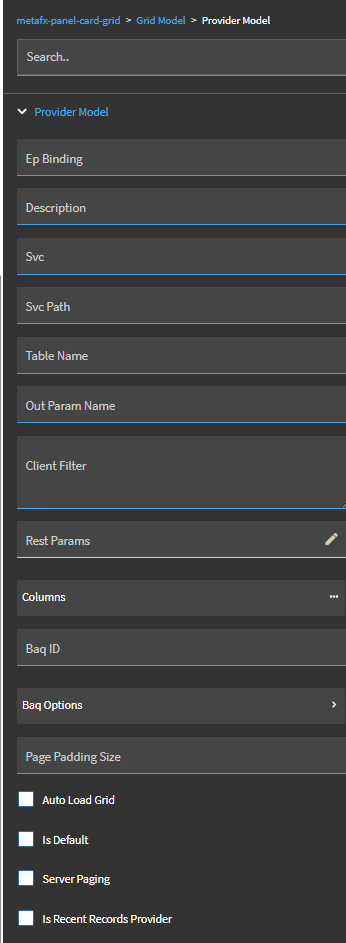
Where you would need to try changing it depends on what you have setup on that particular grid.
I imagine the reason it is on by default is because if you truly have a grid returning an incredible amount of rows it can be slower but as I said when it comes to filtering in particular (and I believe grouping, I don’t do much of that personally) in 2024.1 at least, it does make an impact as I have some base screens even that will not allow you to filter on a given column unless you have at least clicked the ‘download more’ arrow.
My SOP now is basically any dashboard I make or screen I customize, unless there is a specific need NOT to turn that bug off, I do. I’m not 100% it will solve your problem but I suspect it will, it will definitely get rid of the infinite scrolling/loading at the cost of some (in my experience, exceptionally minimal) additional load time.
Hey, I’ll take it. Turning Server Paging off does make it to where the user only has to refresh the grid once to get all results. With Server Paging turned on, if you Save Layouts with grouping of two separate fields (Warehouse and Bin in our DB), you have to hit refresh twice. The first refresh brings in the ‘column headers’ (just the Warehouse name and Bin name, no Rows), then the second refresh fills it all in.
Now that it’s turned off, they only have to refresh once. Awesome!
However…
The DB still times out on grouped rows with large number of records. One of our biggest Bins take 13-15 seconds to expand. Every time. On a terminal server with slower speeds, it crashes the browser after 45 seconds.
Removing the grouping literally breaks the App. Crashes all Epicor windows.
AHHH
Thanks so much for removing one annoyance!
PS. We’ve also never been able to successfully Save a grouping in App Studio, it’s always a personalization. Upgrading the Personalization to a Layer does not carry it over.
Summaries also doesn’t save in App Studio, another personalization
Has anyone else figured out how to deploy a DB with a grouping and summaries already set for the user?
I deployed my dashboard with grouping from classic into kinetic, then I had to locate the dashboard in app studio to publish it. I also had summaries on specific columns in my dashboard deployment but they didn’t carry over to the kinetic app. The groupings did carry over from my deployment, but I still have to refresh to get the data, and yea its slow/unresponsive.
I have seen improvement in Browse Grouping in 2025.1 released on pilot today.
Groups with 50 records or less = 1 second = Very Good
Groups with 250-500 records open in 3-4 seconds.
This is with Server Paging Turned Off.
Border line acceptable, 4 seconds is a long time to click and get no response in this day and age.
We reported the same issue after the 2024.2.12 update. We were not seeing it before that release. Even so, we got added to PRB0268342. That didn’t make much sense since that was opened for 2023.1.7 and is accepted, not planned yet.
Are you in the cloud? Can you test that DB in your 2025.1 Pilot environment? Our issues are still occurring in Production 2024.2.12, only with the most recent update to our Pilot environment am I seeing things speed up.
Hugo, can you go further into what you mean by it not working for some users? Does the dashboard not load data or give errors for certain people or something?
Can you show a screenshot of your DB (redacted if needed) so we could see what’s going on?
We’ve had some growing pains with our DBs, maybe with some shared knowledge we can figure it out.