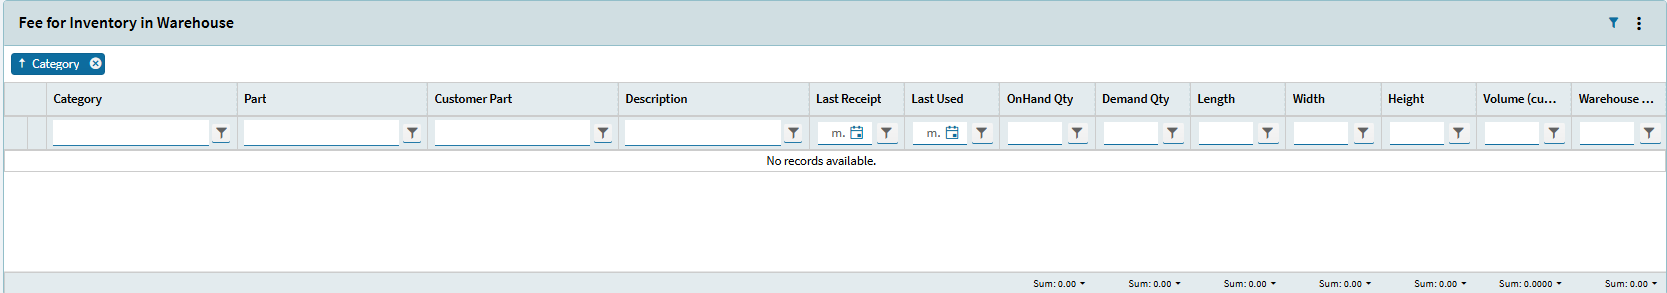
I have built a Kinetic dashboard in version 2024.2.10. In the Panel Card Grid I have check marked Show Filter and Group Options. My goal is to group by summaries just like is the post Kinetic Dashboard Group By Summaries. After dragging Category to the Group By area and clicking Show Summaries, this is my result.
I have tried to Save Layout but this display will not save. I have tried to Save a Personalization but still no luck saving this display. Is there any way to save the grouped by and summary setting to a Kinetic dashboard?
Thank you for the reply. I appreciate you helping with my issue.
Yes, I have allow personalization checked for my user account. I am able to hide columns and change column size on other screens and save the personalization successfully. But I am unable to save the layout for group by and show summaries on a custom built dashboard.
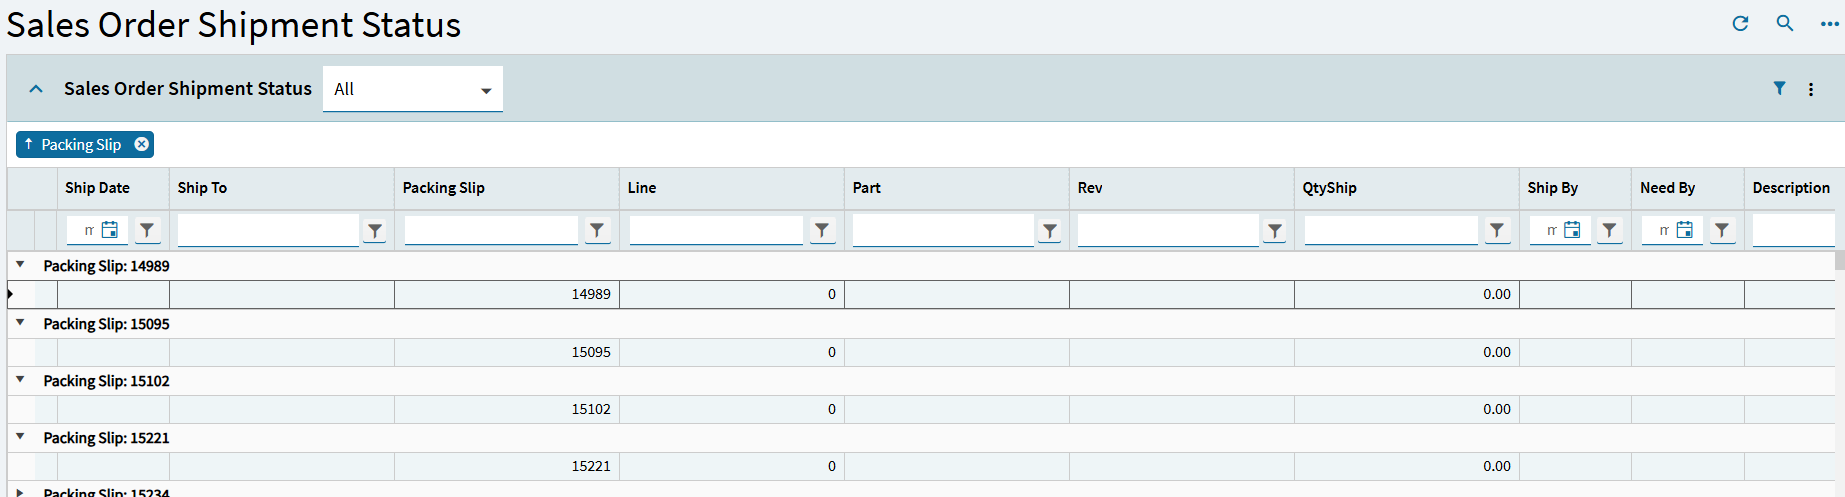
Can we determine this is related to a custom dashboard or not? What happens if you open the Sales Order Shipment dashboard and try to group by the Packing Slip?
Hi Simon,
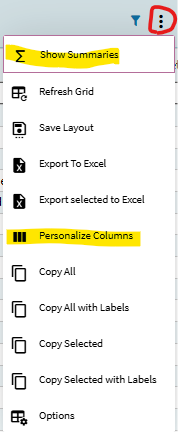
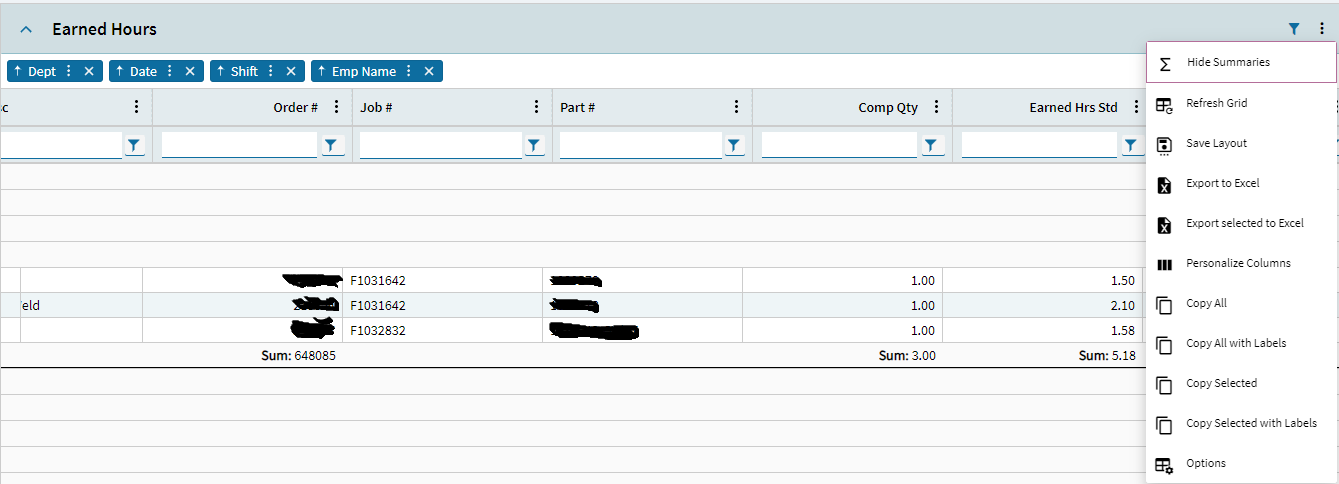
At the 3 dots I can see Show Summaries and Personalize Columns. I do not have Group By.
I can show summaries successfully and save the layout and it will stay.
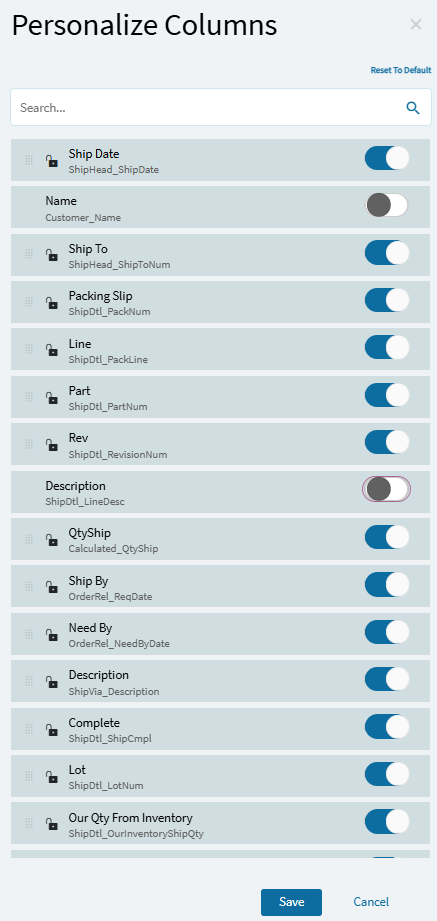
I can successfully hide columns and save the personalization using Personalize Columns.
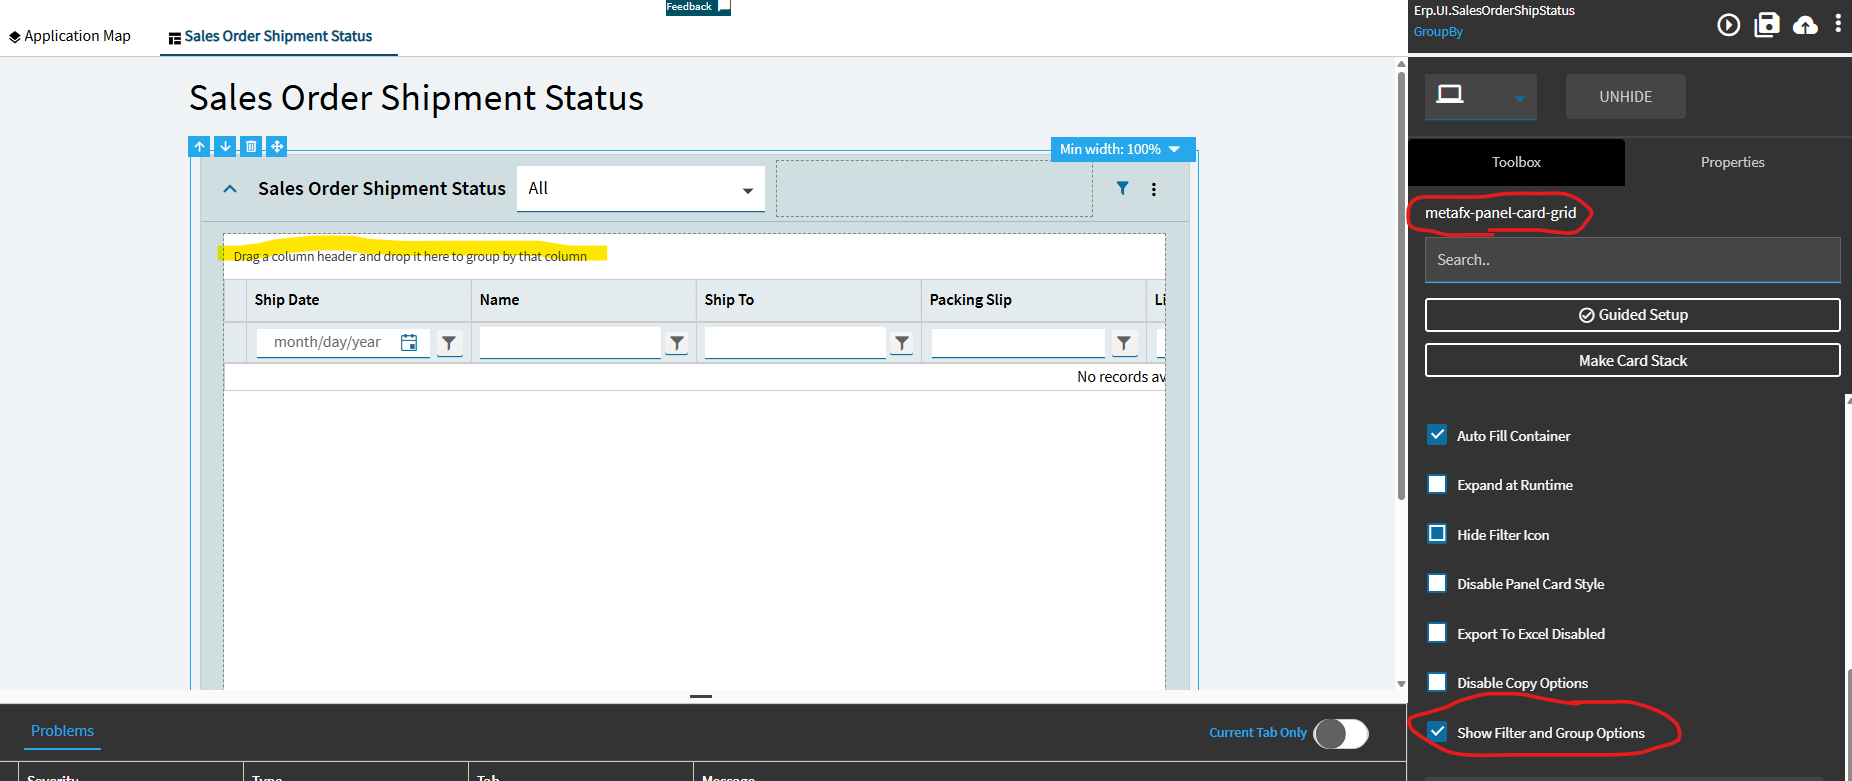
In my custom dashboard, for me to be able to group by, I must click the Panel Grid Card, go to Advanced, and then check Show Filter and Group By Options (in application studio).
For the standard Sales Order Shipment screen, I must go to application studio, and check show filter and group by. Customizing this screen is the only way that I know to group by. I can save the customization with its group by.
I can play the layer and see the group by. Then I published the layer and linked the customization to the menu.
As of right now, I can not see the group by on the published layer that I assigned to the menu customization. I know that when opening the menu that I am on the new layer because I see this in the URL.
I can see the summaries, I still have my personalization, but no group by at the 3 dots and no group by from my customized layer.
Thank you for the picture and video. It was helpful. I get so stuck on one path. Thank you for redirecting me to use the little filter or group by icon.
I used the little icon to make the group by. Then I dragged the category into the column header. Then I saved layout.
If I have the group by set before refreshing the data, then I get all zeros in all the lines.
If I clear the group by, refresh the data, wait for the data to load, and then drag the category into the group by, the screen will show accurate data.
The same issue is happening on the Sales Order Shipment screen, a standard Epicor screen. I dragged the Pack Slip to the group by and saved the layout. The next time I loaded the screen and the data refreshed with the group by already there, I receive all zeros for all the lines.
Hello - I’m wondering if you received a resolution for this. Did they create a PRB case? I am still seeing it as an issue and it’s pretty much a show stopper for going fully Kinetic on some of our dashboards.
Hello Brian,
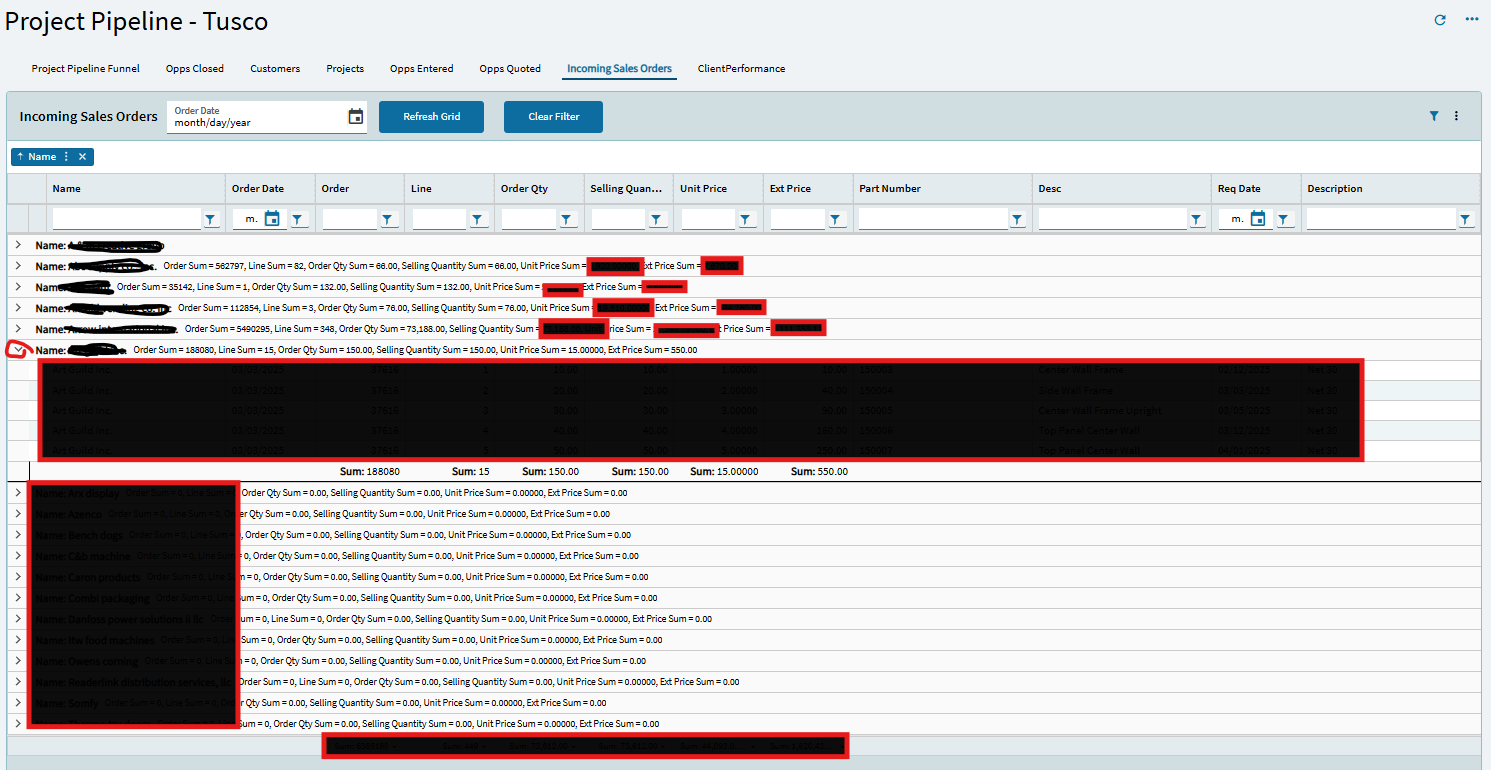
Epicor has listed the problem as resolved. They have made significant strides to solve the problem. I have still noticed 2 minor latent issues. One, if the dashboard doesn’t load all the data then you can’t group or summarize it. Second, when grouping and summarizing the data, the first line of the summary doesn’t show any information. The work around is to click the down arrow and then it will populate. In general, much as improved for grouping and summarizing and it is workable for us. Can you share your specific issue and a screen shot?
Heide
Thanks for the response. What I’m seeing is that we have to click Show Summaries each time the dashboard is loaded, and again if you refresh it. I can group it a certain way, check Show Summaries and save the layout. The grouping will save but not the show summaries. Ideally it would work like Classic does where I could deploy it with the groupings and summaries, but only the groupings will be in the deployed dashboard.
Hi Brian,
Yes, we still have that issue of a saved layout doesn’t show the the summaries properly all the time.
To work around the issue, for dashboards that people will group by, filter, and summarize, I try to have all the data load so the user never gets this icon.
To accomplish that task, in the grid model uncheck Pageable. You may also need to go to the Provider Model and check Auto load grid and uncheck server paging.
I have also informed users that group by and show summaries does not always work 100% of the time. If they have saved the layout with show summaries, and it is not working, then I tell them to click the 3 dots and “Hide Summaries” then go back into the 3 dots and “Show Summaries”. This usually displays the data as they want. Occasionally, you get 0.00 for the summary. But when you click the down arrow, the summarized numbers appear.
Not ideal. Not totally fixed. But we have decided to keep going and get used to the glitches and hope they get resolved with time. We are on 2025.1.8 as of this post and it is 8/8/2025.
We’re also on 2025.1.8 and when a user tries to ungroup it freezes their browser. I tell them just to refresh instead and it’ll ungroup when it reloads. Kinetic growing pains are
another issue with the dashboards is that when you select only 1 column for summaries and set the rest to null, save layouts, it will not keep that setting either and every time you open the dashboard, it will continually show all summaries for all columns and you have to manually turn all the columns off that you don’t need the summary for.