Kinetic Debug Error Fun

Hey,

When I go into debug mode on this layer, it won’t show the component logs with Ctrl-Alt-L. I can see it if I load another app. So, I got to looking.

I’m wondering if an error has broken something that stops the component logging, and I do have some errors showing in the console:

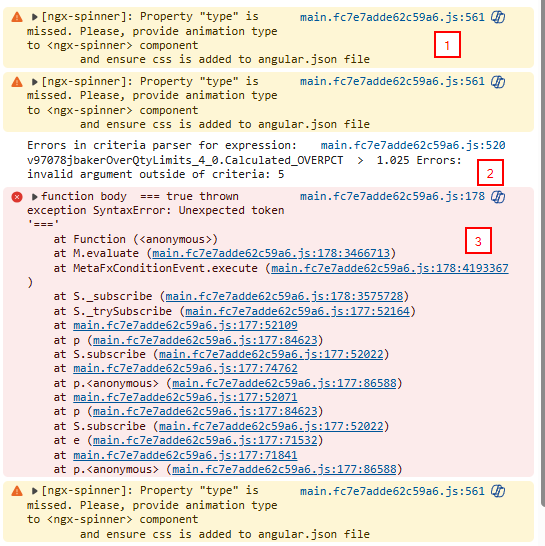
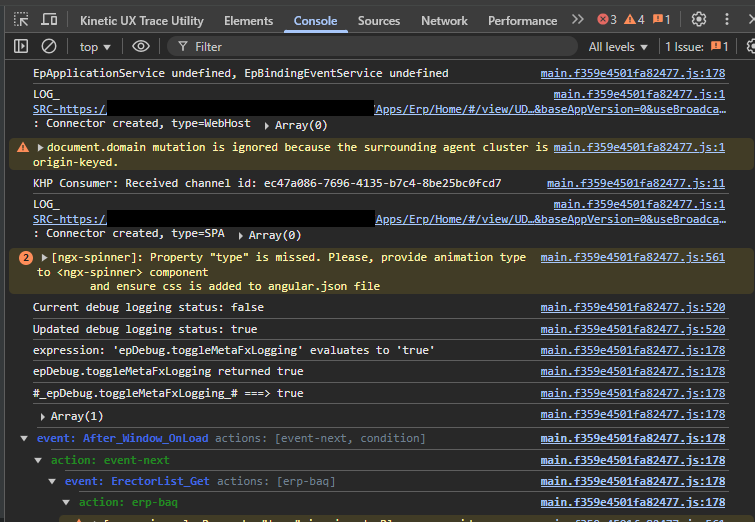
Not sure what the ngx-spinner error (1) is trying to tell me. I am setting the hidden properties of some controls on and off. Maybe that has something to do with it?

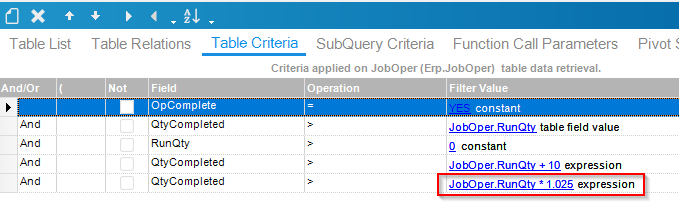
Then there’s “Errors in criteria parser. . .” (2). The only place I can find this 1.025 is in the BAQ it’s accessing:

image

And then there’s the pink box (3).

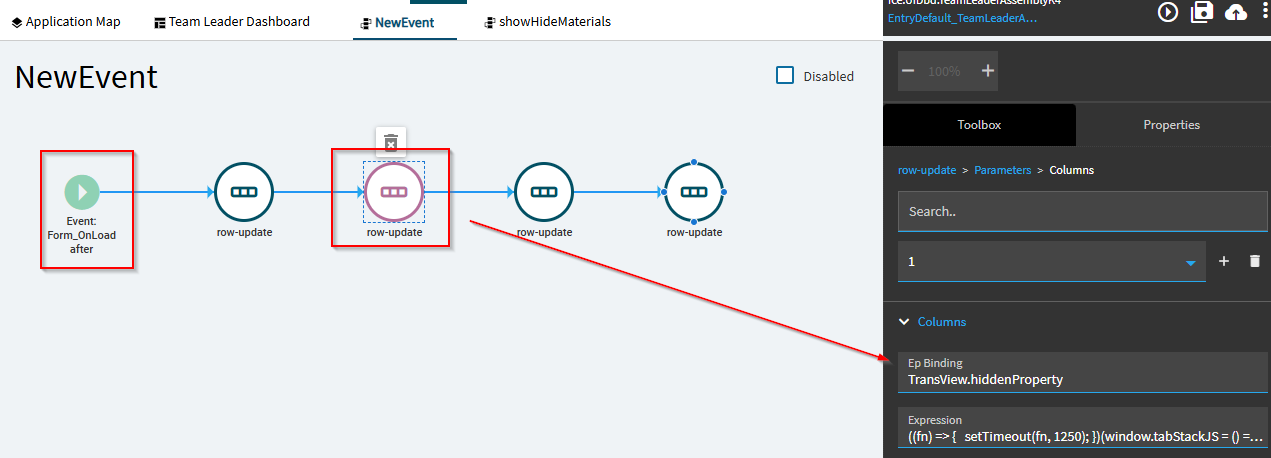
I have three watchers set up to see which panel card grid in a stack is active and set a flag up in a TransView field when that changes.

Where the function in the expression field is:

((fn) => {
  setTimeout(fn, 1250);
})(window.tabStackJS = () => {
  const outerElement = document.getElementById('metafx-panel-card-stack-9a6b5');

  function updateVisibility() {
    const visible = document.getElementById('metaFxPanelCardGridShopLoadReport')?.offsetWidth > 0;
    trans.dataView('TransView').setAsync('hiddenProperty', !visible).subscribe();
  }

  const observer = new MutationObserver(updateVisibility);
  observer.observe(outerElement, { childList: true, subtree: true });
  updateVisibility();
});

Chat GPT and I can’t find anything wrong with the function. The error goes away if I take the expressions out of the row updates.

It all seems to work okay, though. I only looked because I want to see the component properties in the debug and that doesn’t work.

Does any of this look familiar?

Thanks,

Joe

2 Likes

Well, I closed the browser and restarted it and the component logging works now, but I wonder about those errors anyway.

Joe

2 Likes

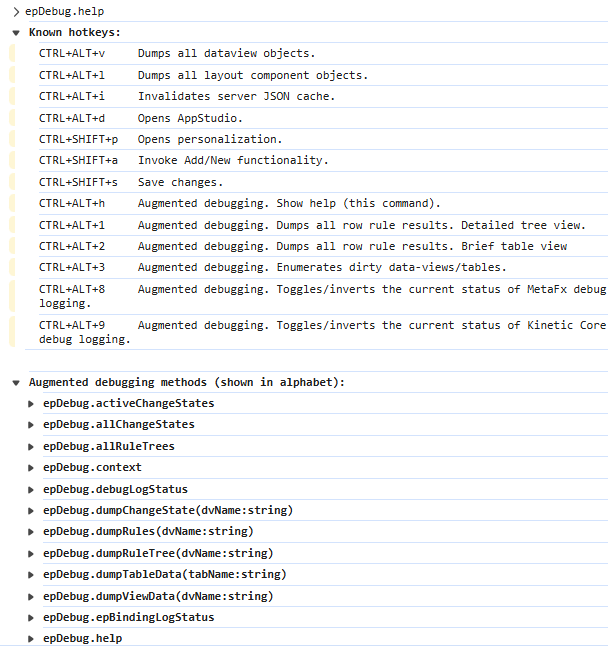
I have a bug open regarding ctrl-alt-L not functioning reliably. I’ve experienced it being non responsive in several scenarios and i’m not sure what triggers it. Closing the browser and re-opening sometimes helps, switching browsers sometimes helps, private mode sometimes helps, reboot sometimes helps.

It’s the definition of inconsistent!
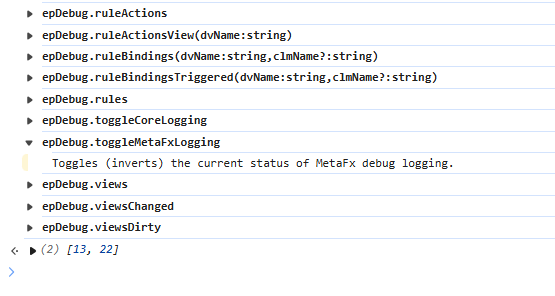
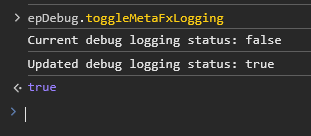
I asked Epicor if it’s possible to trigger the ctrl-alt-L action from a console command, similar to the stuff exposed in the EpDebug object. Because when it’s not working, I don’t see the text in the console saying hotkey triggered, so I’m imagining something is getting stuffed up with the hotkey listener.

It is almost like browsers weren’t built for this kind of application! :thinking:
When is Epicor going to split off a branch of the company to maintain the desktop client so we can all finally ignore Kinetic for good!?

3 Likes

The browser is much faster than the client tho, I’ll give them that.

You can trigger the views, and a lot of other things from the console. Note the following seem to be case sensitive.

Try:

epDebug.help

image

It lists the hotkeys and then gives a list of methods you can enter on the console.

Type:

epDebug.views (requires logging to be toggled on)

and get:

image

You can also trigger debugging as the form loads in case you’re getting some error before you can get to the debug.

This is an event that turns on debug mode before the form load event so we can see what happens up to the point an error occurs:

The trigger is before Form_Onload. It writes #epDebug.toggleMetaFxLogging# to the console.

Cool stuff.

Joe

3 Likes

Unfortunately, Logging Component Models does not seem to be exposed in the epDebug object.

This is amazing! I have definitely struggled tracing what was going wrong when loading and this works perfectly!

I am not sure if this is working for me.
I put this event in


and added the action console-write

Then I open DevTools with F12 how do you tell what state the epDebug logging is in?

I don’t think this console-write is working. If I toggle the logging with any of the available options
CTRL-ALT-8, Debug Toggle from the preview

or the epDebug.toggleMetaFxLogging from the console after F12 I get this

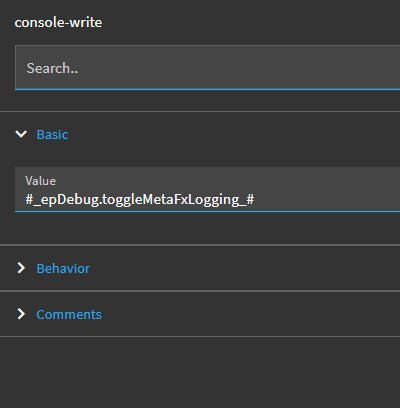
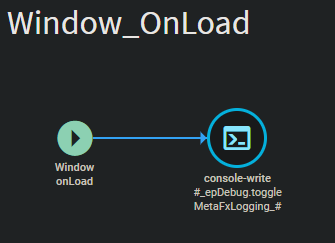
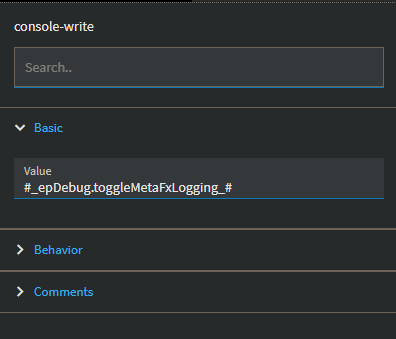
This means to me it was not toggled to true with the console-write.
What am I doing wrong?
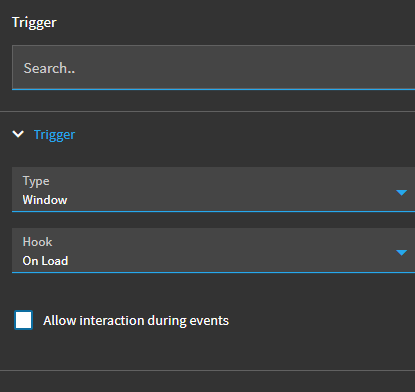
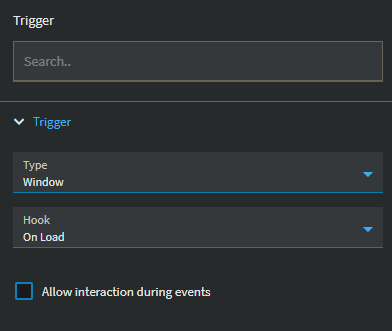
I am very new to this Application Studio (“Not Ready for Prime Time Players”) so if you show your event please give me some screenshots so I can see where you are entering the parameters, properties, etc…

Thanks for your help!!!
And Thank you to all those that gave the ultimate sacrifice…
Happy Memorial Day Thank You GIF - Happy Memorial Day Thank ...

Event:

Trigger Configuration:

Console-Write Configuration:

I can either preview from application studio, or open the published dashboard, and when I hit F12 to open the browser dev tools, this is at the top of the console tab.

1 Like

That’s correct.. It enabled it

Not sure what I did but it is working now. Thanks

1 Like