Forgive my ignorance, but in all the labs at insights for the past couple years all the tracing we have done has been using dev tools where you trace what you’re doing at the moment…
I have a client who is reporting an issue with quickship where she is freighting a shipment, the label comes out, then a second later a second label pops out with a different tracking number, but all the same shipment details as the first one. So… our user goes and looks in UPS and it turns out the first label/shipment was voided… but she never unfreighted or voided anything, she just hit freight…
So… I’m trying to trace out what’s happening, where the void/unfreight calls are coming from and I was thinking a client trace would be the way to go since this is sporadic and not happening every shipment. I know how to do it in classic and classic writes to a file which is nice… but is there a way to make this happen for Kinetic forms and tracing their rest calls?
I am cloudily remembering an option to log it to a server file, but alas, I can’t quite remember.
In short, is there a way to log kinetic client trace to file?
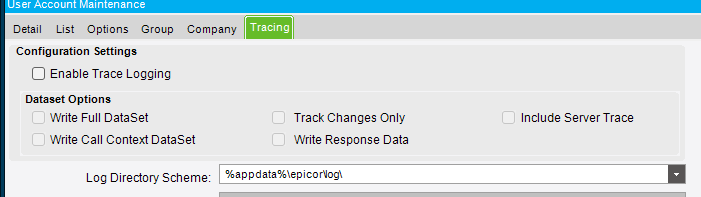
You use the Tracing sheet to activate client tracing for the current user account. Through this feature, you can control when a client trace log runs for a specific user and then turn off this log when you no longer need it.
The tracing log is a tool that has several uses. Web service developers can use this log to see what business logic calls are made when users launch a specific function; for example, the business logic calls made when a user enters a new customer record. Custom programmers can use this log to fine-tune their customized applications. Epicor Technical Support may also ask you to turn on this log to help them track performance issues or other technical issues.
@hkeric.wci and Kevin and @jkane, we use a smart client and launch kinetic screens. If I enable the client trace from the classic screen, it will then log anything she’s doing in the kinetic customer shipment screen yeah?
That’s the basis of my question then… how do I log what she’s doing in her kinetic screen all day long? Or at least for a reasonable period of time to try and track down this issue?