I have a dashboard I am trying to create that aggregates a lot of data from many different BAQ’s. I have a main page and a couple lower level tab pages as shown.

I am trying to create a panel card stack of panel card grids on one of the pages and am running into some strange behavior. When I create the panel card grids and then stack them, I get the stack as expected but am still seeing the grids separately as well.
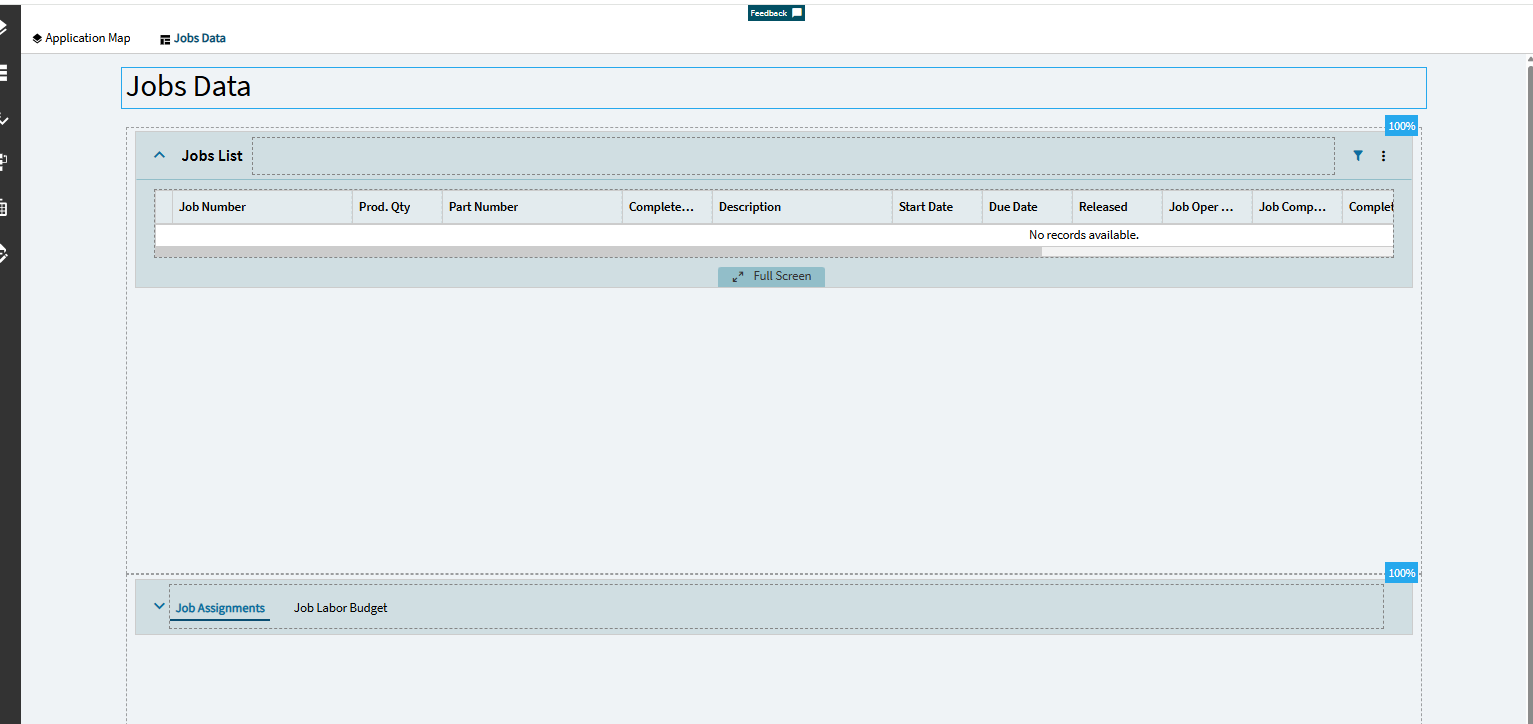
Here is the Jobs data page in design - you see a jobs list grid and the a panel card stack with Job Assignments and Job Labor Budgets (two panel card grids in a panel card stack)
When I preview the dashboard, I get the Job list as expected, I also get the panel card stack as expected showing the two data grids but I also get the two panel card grids separate after the stack.
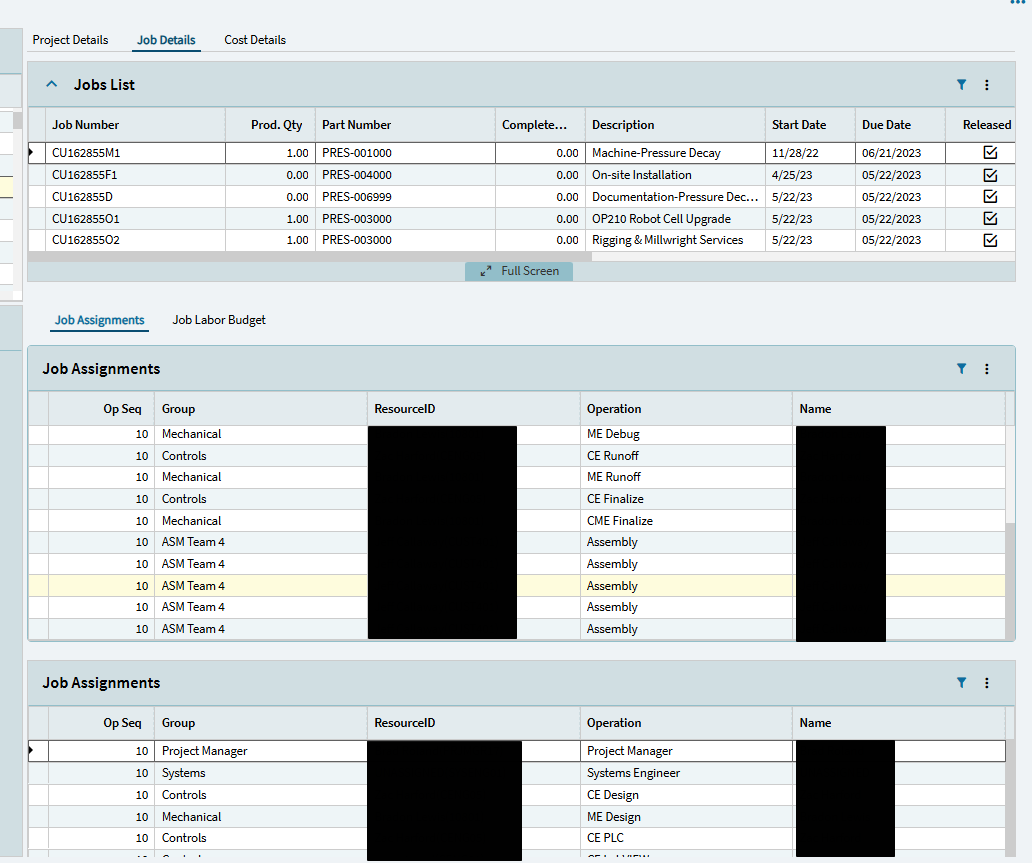
When I scroll down, I could see the separate Job Labor Budget grid as well.
This has perplexed me for a while and I am struggling to figure out what is causing this. I have done many dashboards with panel card stacks on the main page and have not seen this issue before.
What am I missing?