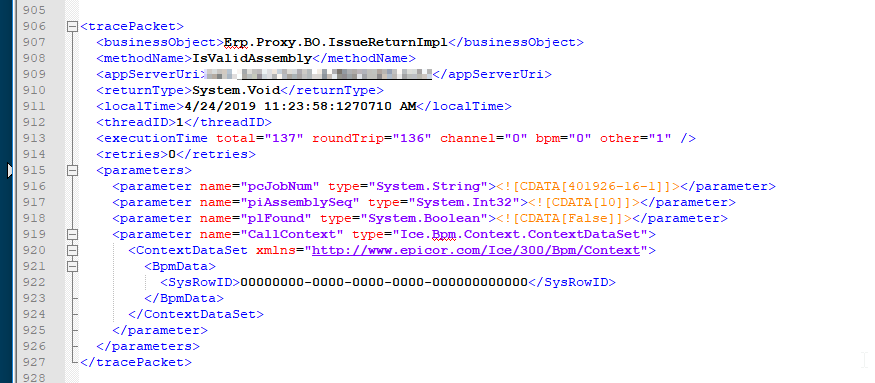
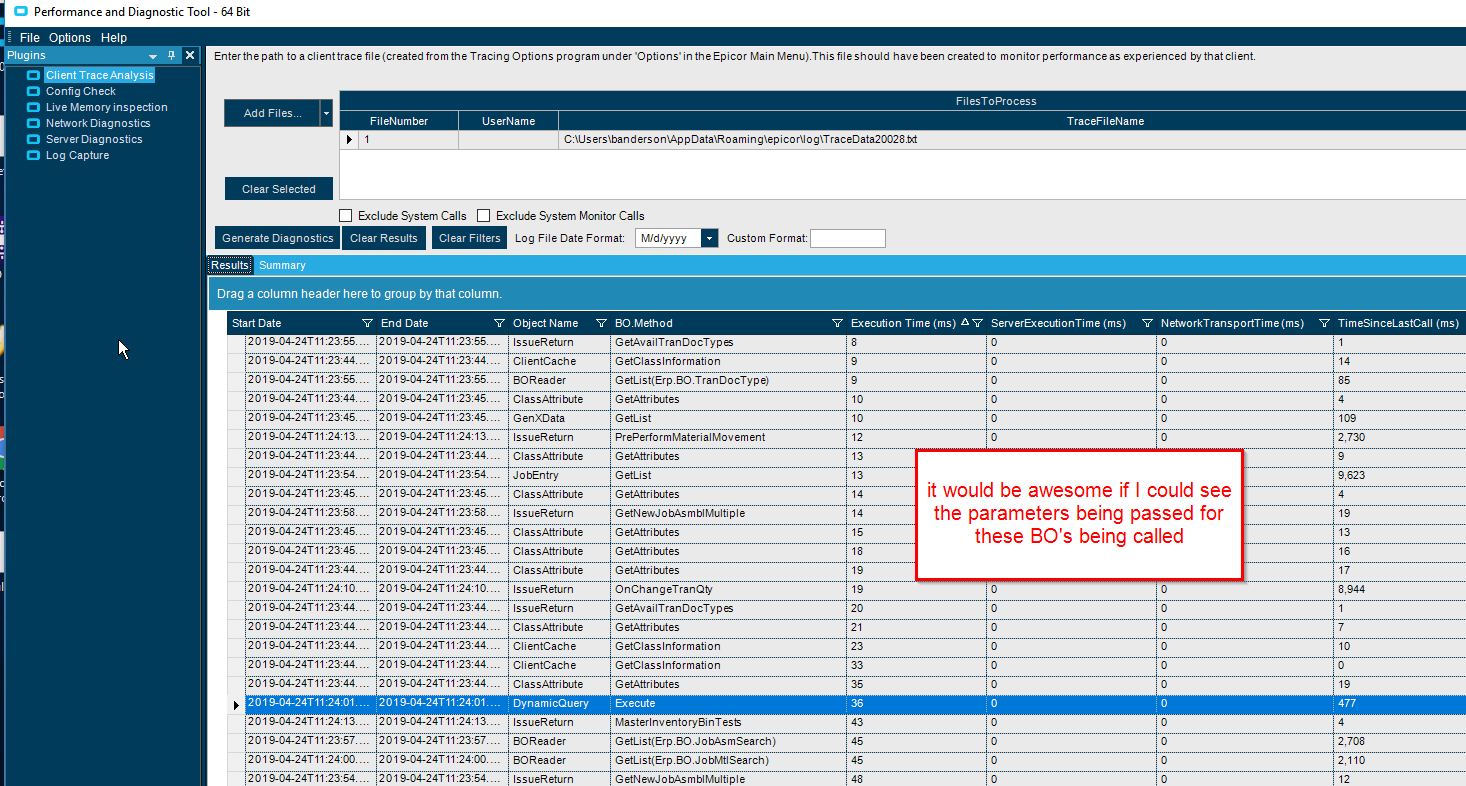
I know that it’s not really what it’s intended for, but using the PDT tool to look at a trace is quite handy to see what’s being called, and it’s easier than looking through the XML. I’m trying to read a trace to duplicate it in custom code, so not necessarily for performance.
Is there a way to have the PDT show the parameters that are passed from within the tool? Or do I have to go back to the text file and look myself?
Just wondering if I am missing something here.
I can get them from the XML, I’m just looking for a lazier way to do it…