This is a BAQ question, but I will illustrate in Excel.
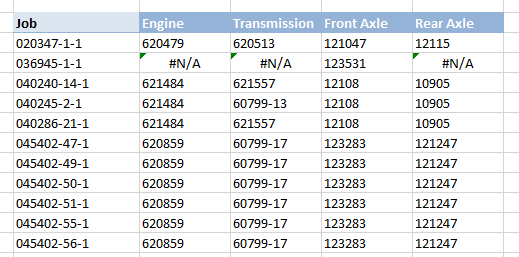
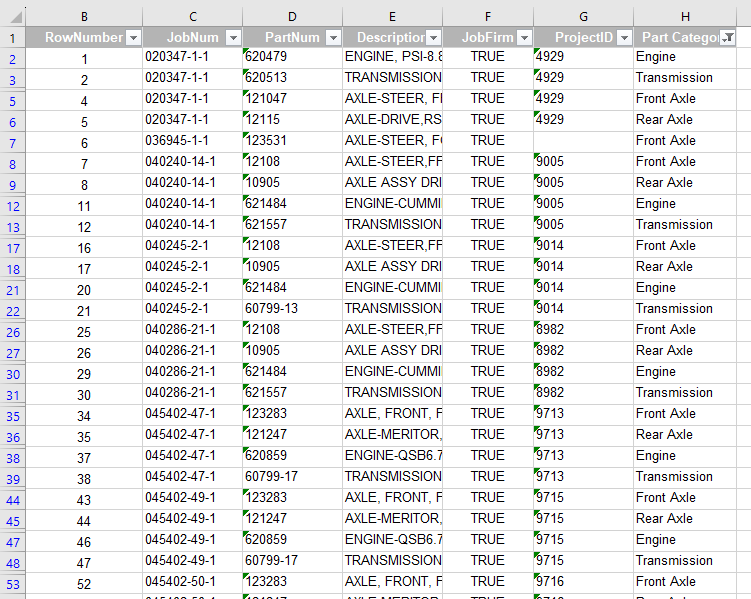
I have this data - job numbers and some serial-tracked part numbers that were issued to those jobs. I categorized them into 12 groups, like:
Engine
Transmission
Front axle
Rear axle
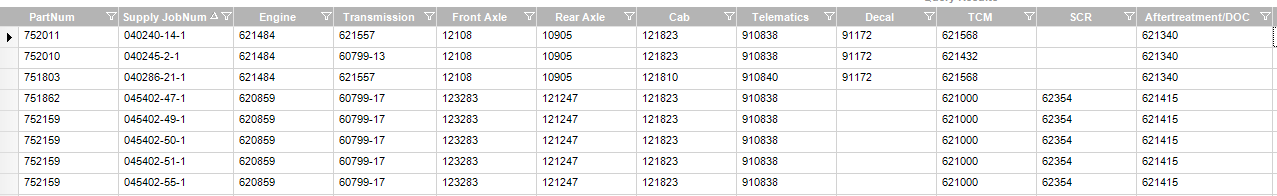
I want a result with those categories as column headers and a single job number per row, with the part number of the component in each category column.
Like so:
In my mind, I have “pivot-ed” the data, but a “pivot” - in SQL and Excel - is an aggregation of numeric data, or a count of non-numeric data, but that’s it - the result is always numeric, not some field from a row.
Right? Or could this be done in a BAQ? The only way I know would be death by 12 subqueries.
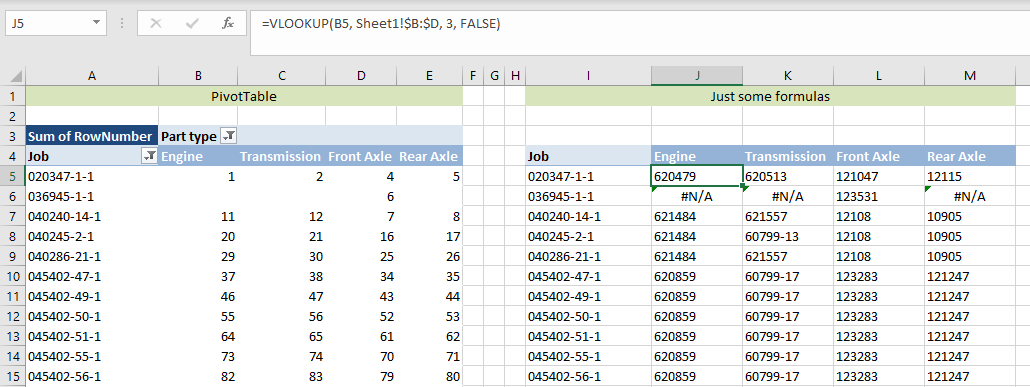
In Excel, I hacked it like this. I numbered every row, then pivoted the “sum” of those row numbers, but it’s 1:1, so I end up with an index that I can VLOOKUP off of.
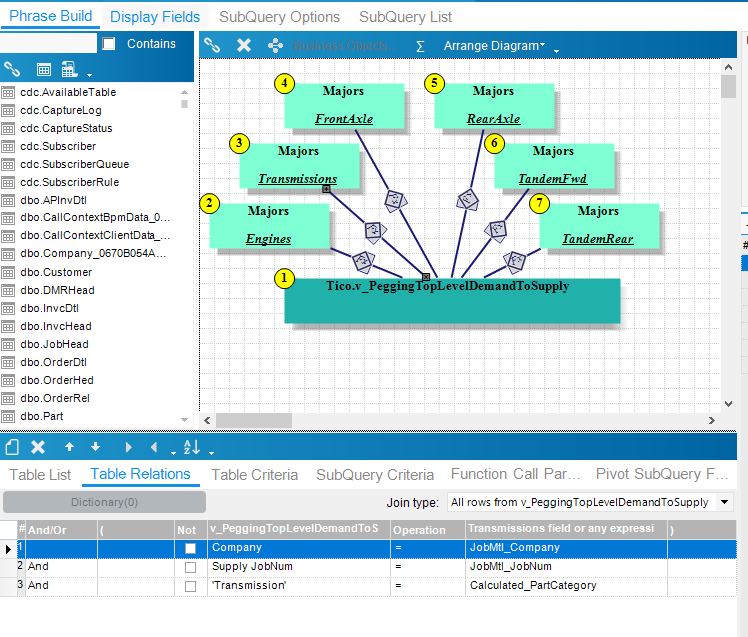
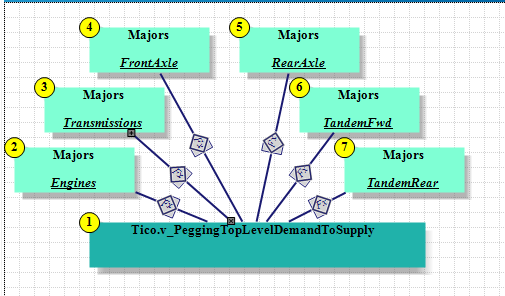
This is the way. Yes, it sucks to make a separate subquery for each one, but if you know you need that many from the beginning you can make it a little cleaner by naming each subquery for the category it will return results for. That makes the visual joins a little easier to read. Then just join it all up on the top level by job number. It looks like you are not trying to return serial numbers just the part numbers, so these subqueries should be pretty simple. Post up your BAQ when you get close and we can help fine tune it.
If there really is a way to do this without a subquery for each category, I would love to learn it too!
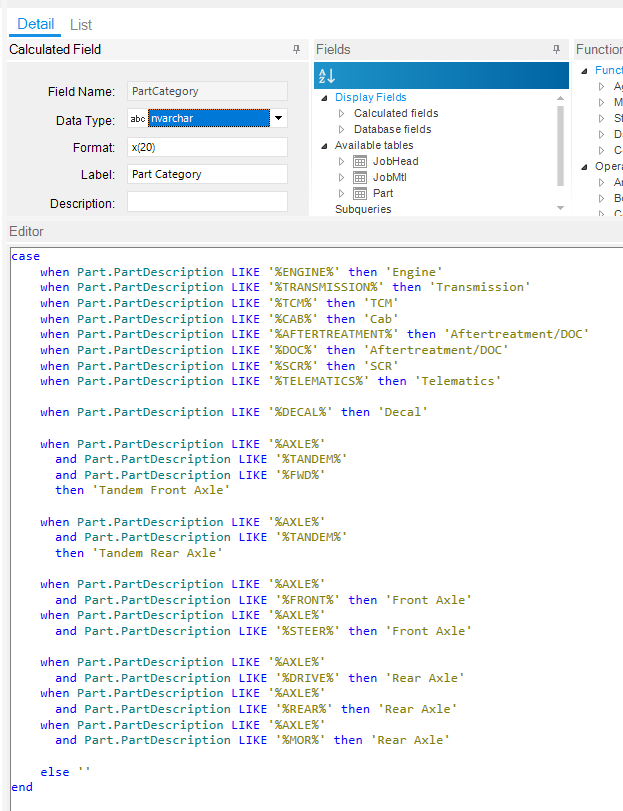
Sure, why would it not? If every job has one or none of each category, just do a case statement looking for the description and then return the part number.
I don’t know. I am just thinking of the Job Number (which will be grouped) and the columns for the part category (which will have the MAX). Is there other data in the query?