Trying to recreate pub/sub behavior on a kinetic dashboard.
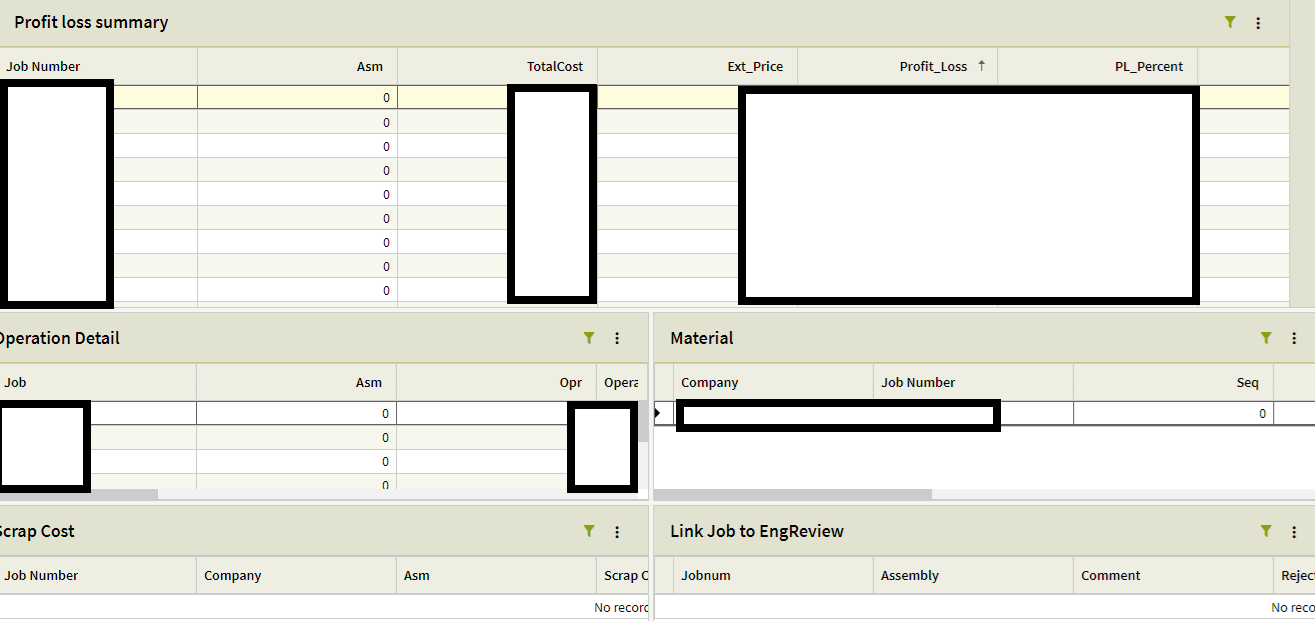
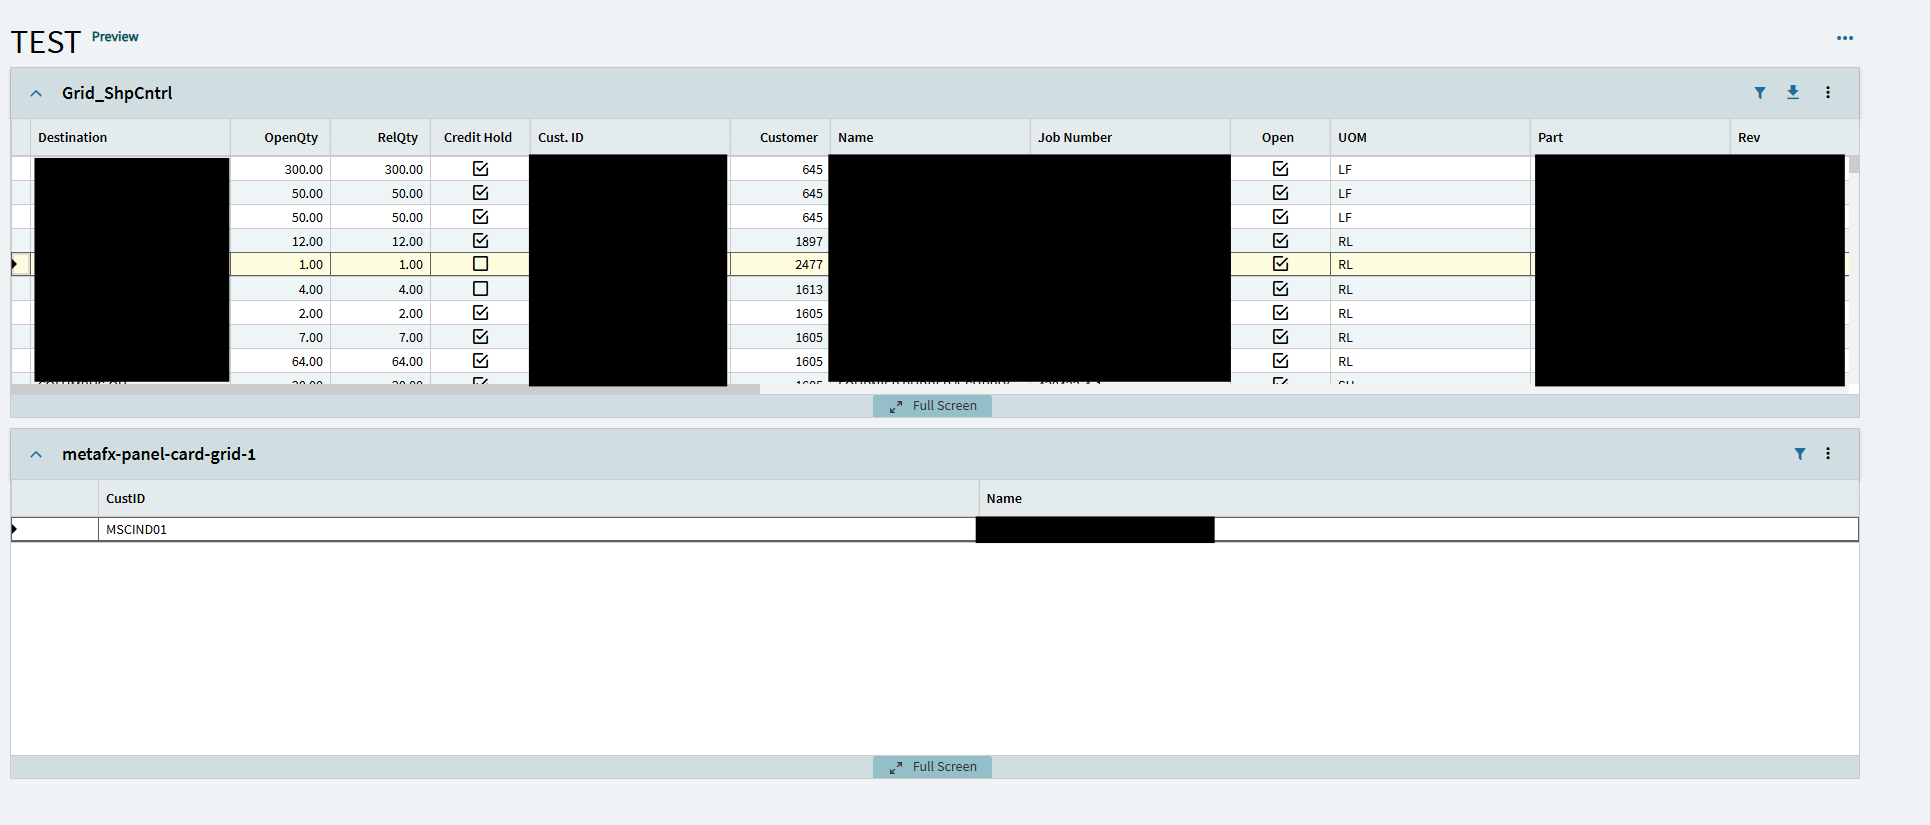
I have the trackers working to fetch the original list in the first (Profit loss summary) grid, and then the four grids below it are hooked to their own BAQ’s, but in classic if I clicked a row, it would populate the grids below based on the published column.
I still have that functionality for the first row that appears after I apply the trackers, it populates all of the grids, but when I move down a row, or to any other row, the rest just stay empty.
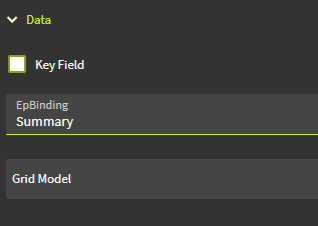
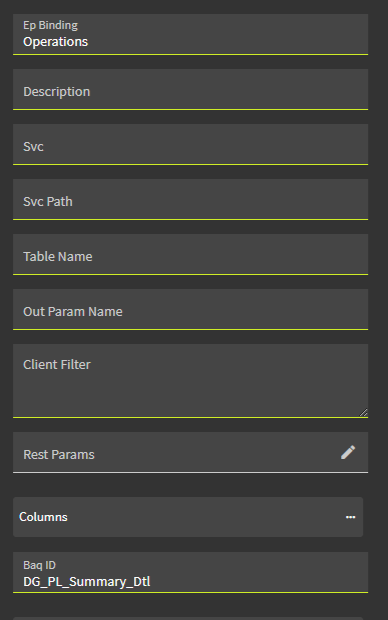
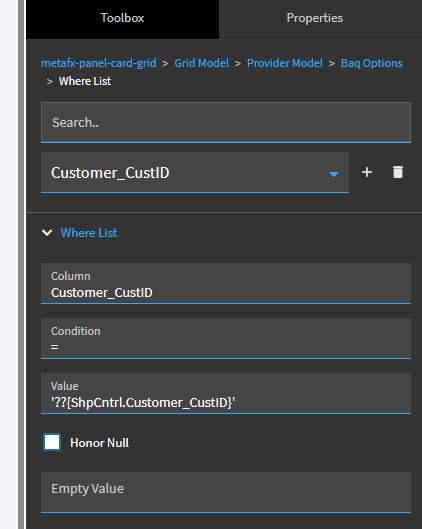
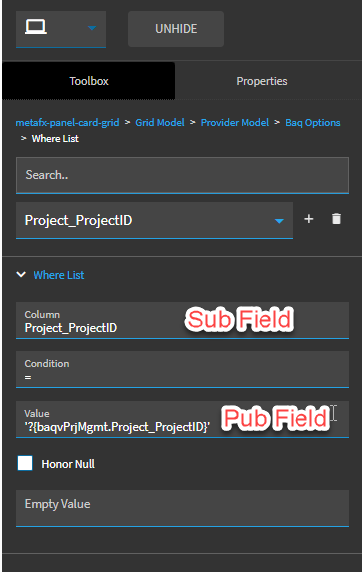
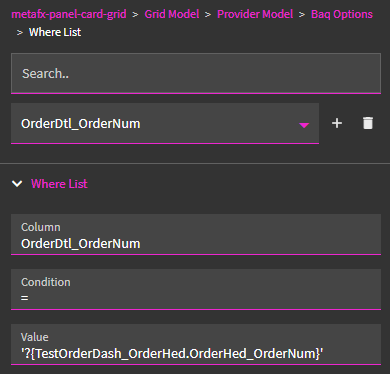
That seems to be what I have, I deployed the dashboard in kinetic so it automatically made those rules. For example The second grids where value is ‘??{TransView.DG_PL_Summary_Dtl_1_0_JobAsmbl_JobNum_Filter}’
(grabbing jobnum from my first grid)
It all seems to work for the first row after a refresh, it just doesn’t update after I swap rows for some reason.
I had epicor’s tool build it for me from a classic. Basically just went to dashboard on epicor, and when i clicked deploy, I generated the kinetic version from it, then went to application studio and opened it.
The update tool is ok with very simple dashboards but struggles with pub/sub ones as you can see. I rebuilt 99% of our 130 dashboards by hand using this template: Taming the Dashboard Dragons of Application Studio
So remaking it from scratch, I got the first BAQ Grid loading properly (loads all rows on launch but I believe thats an option somewhere I can set to tell it not to, so I can build the trackers.)
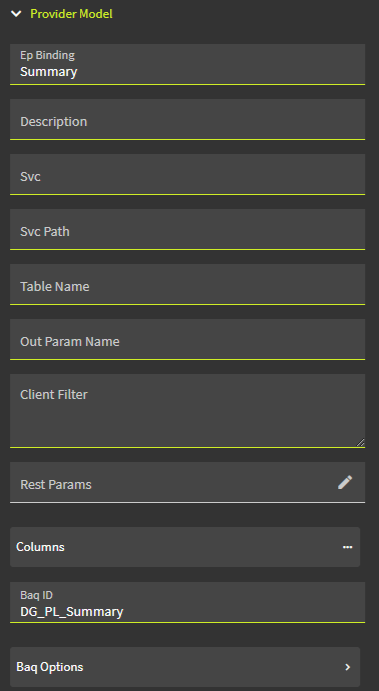
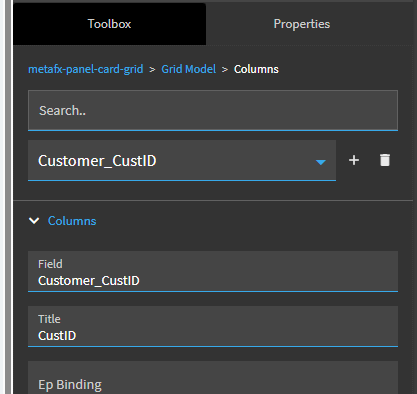
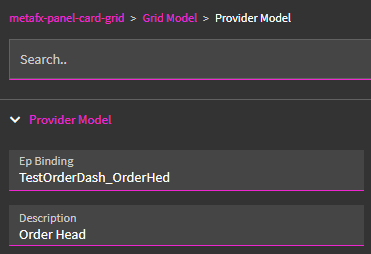
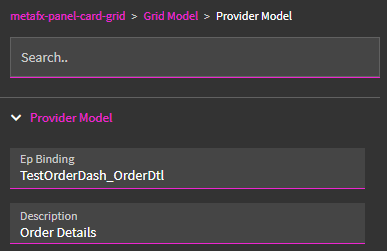
Then, made a second one in the same way, Linked it to the second BAQ, and view.
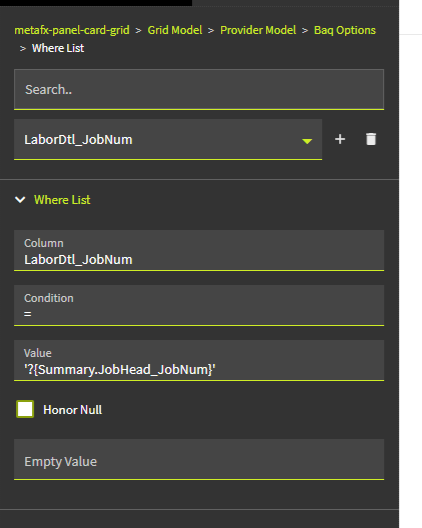
Then in provider model for the second one, I gave it
LaborDtl_JobNum = ‘?{Summary.JobHead_JobNum}’
It’s still just not doing anything. Am I missing something?
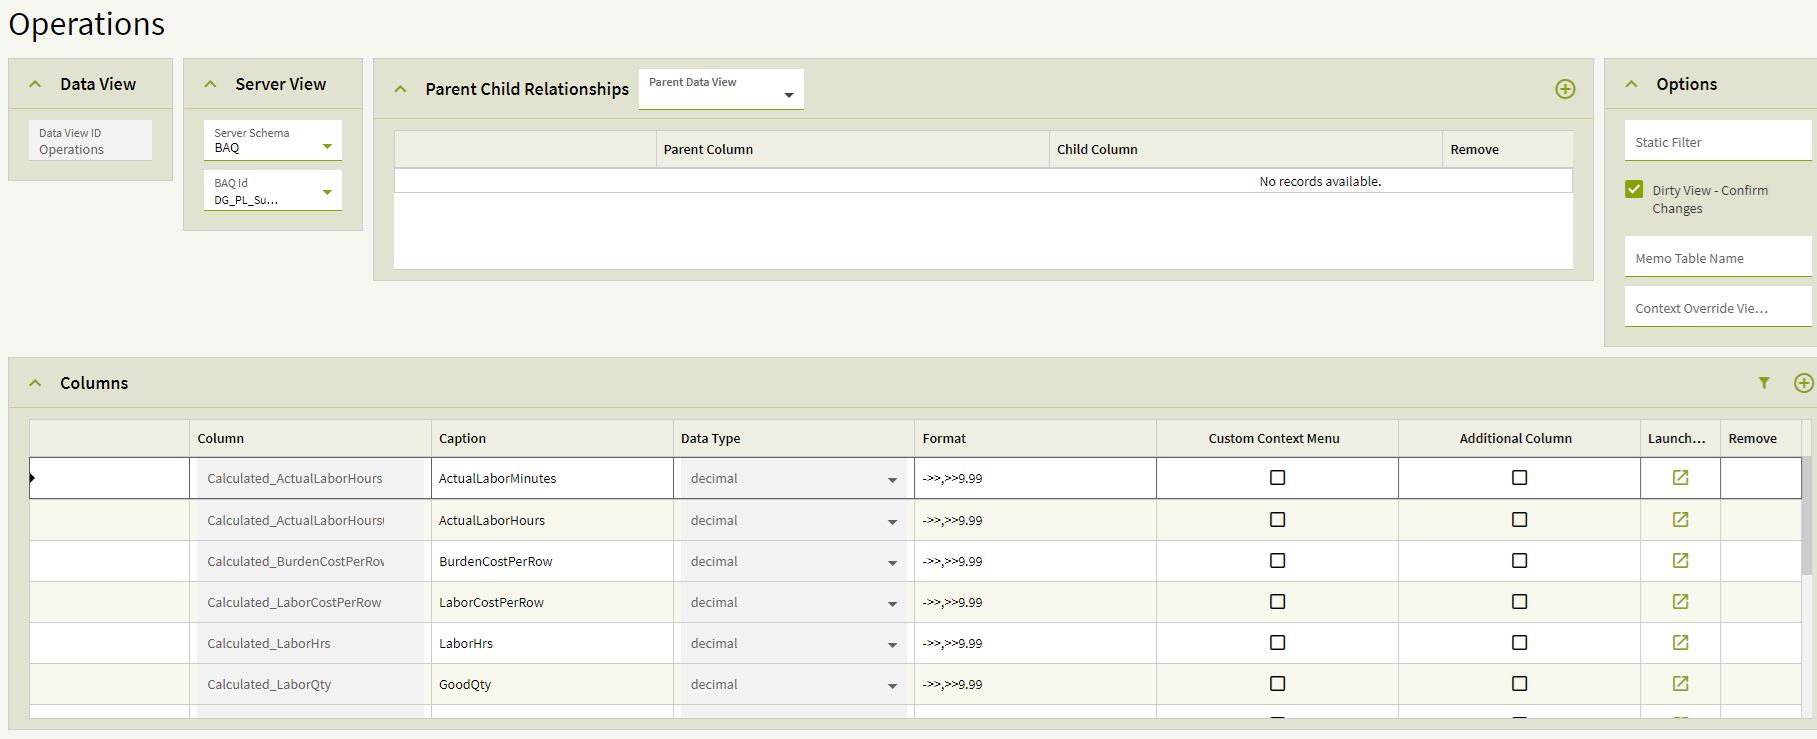
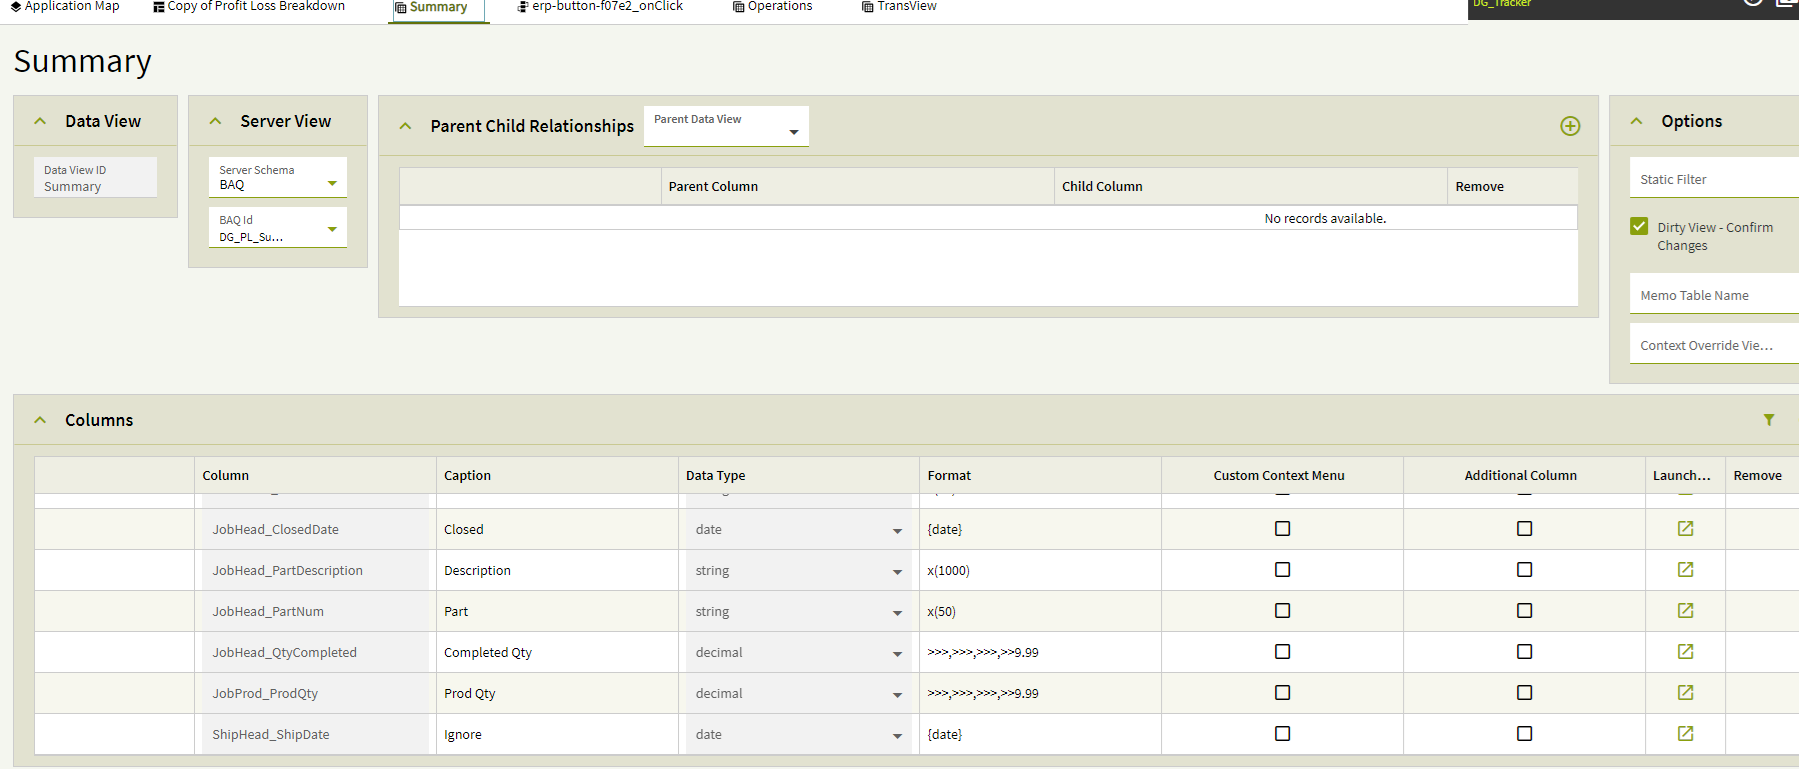
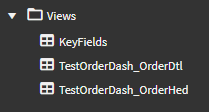
Created the two dataviews from the BAQ’s.
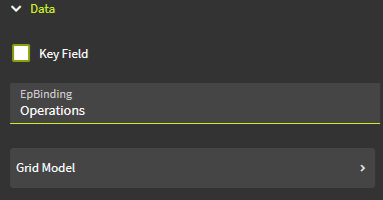
Views: Summary, and Operations.
Second Randy here. The tool worked great for us for DBs that were just data, but for anything we had anything complex there were some funky things that happened. We ended up building most DBs in App Studio from scratch. Kinda sucked at the time, but we learned a ton.
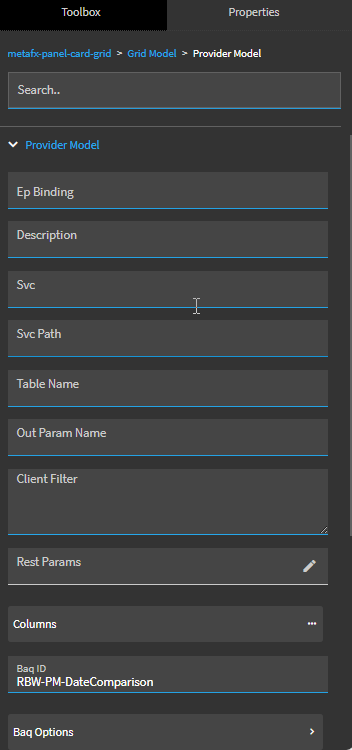
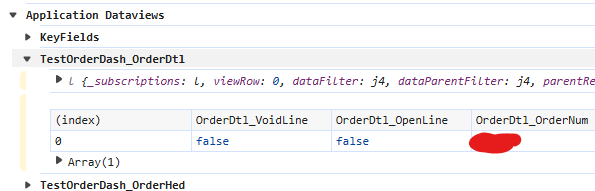
Binding the data view to the Provider Model allows you to see the contents of the data view in the developer console (F12, then Ctrl+Alt+8 and then Ctrl+Alt+V while focused on the Application):
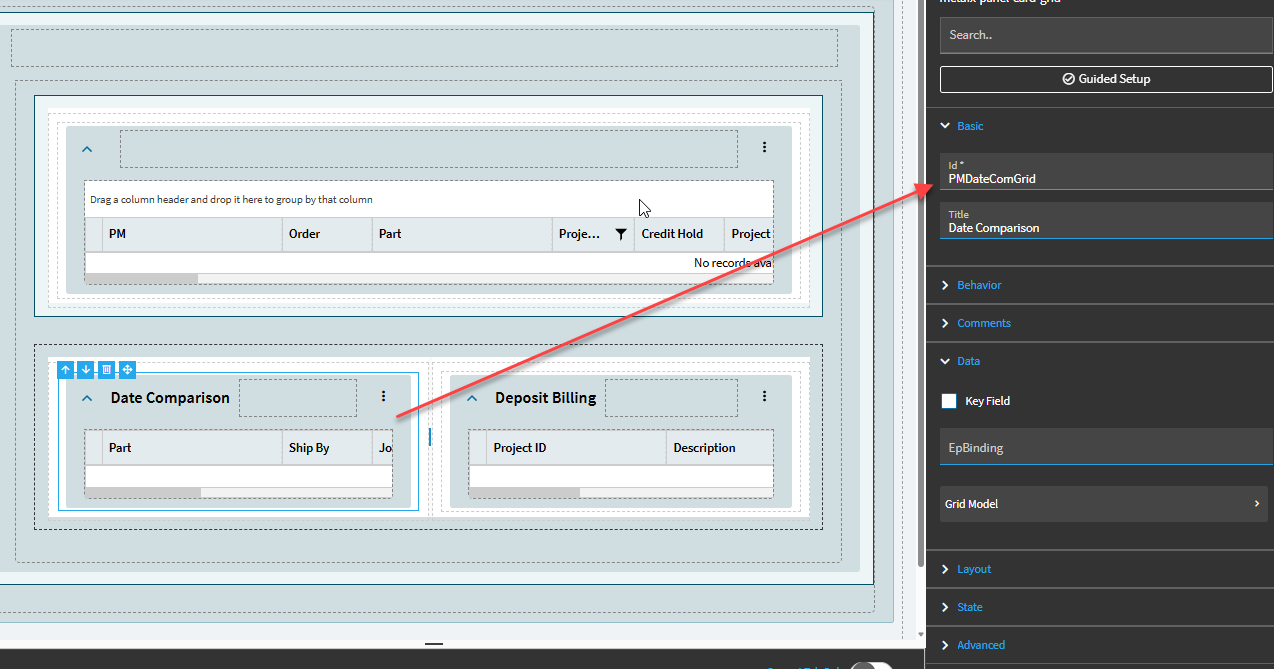
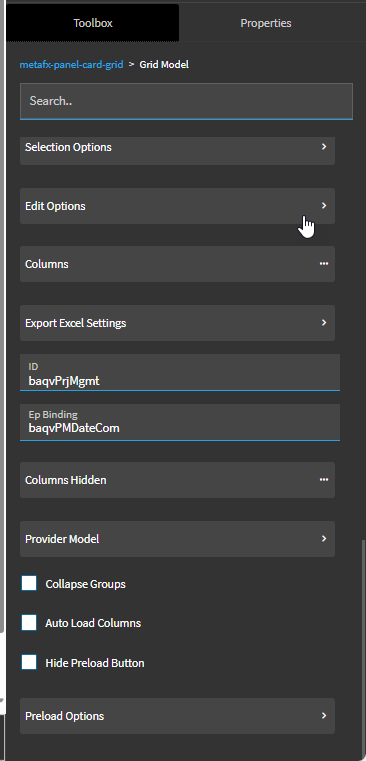
I got it figured out, It was a stupid mistake. Seems the EPIBinding didn’t matter. But after I created the “subscriber” grid. I didn’t run the setup again to link it to the dataview. I assumed putting the dataview inside of the grid model settings was enough.
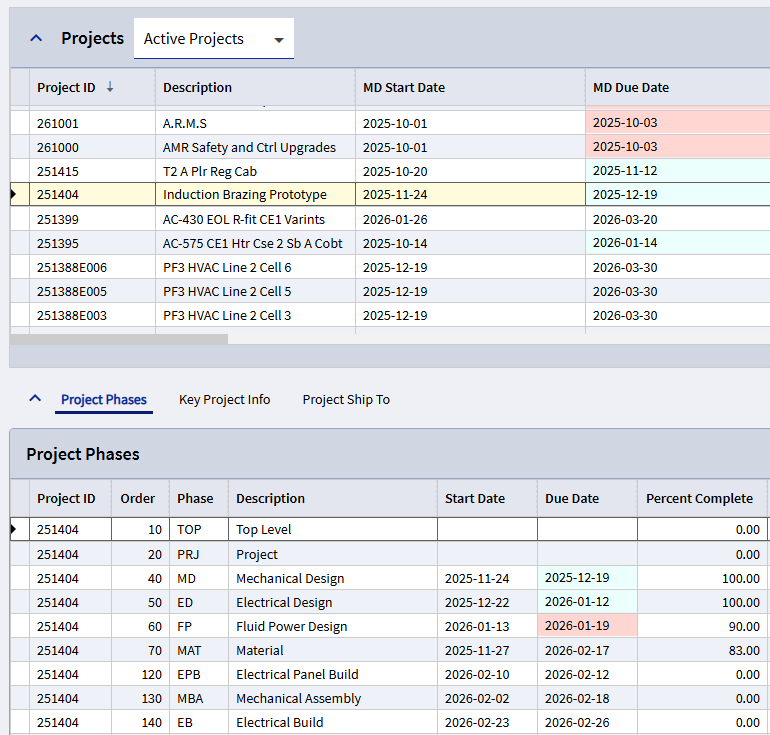
A simpler way is to set up your dataviews with a Parent/Child Relationship. Then it’s all automatic. In the example below, the ProjectPhaseDates dataview is set up as a child of the AllProjects dataview, with parent/child columns set to ProjectID. In the dashboard, when a project is selected in the top grid, the Project Phases grid populates with data for that project.
Good to know, thanks. Server Paging is off by default in my experience and we turn it on only when expecting more than 5,000 rows. But I will definitely keep this in mind.