Many of our users complain about lag time between fields when doing data entry.
Example: Entering a PO. type part number, hit tab, wait, wait, wait, type quantity, wait, wait, wait, type price.
If you forget to wait and start typing too soon the data is lost and field remains empty. Worst case is when you skip and important field and it yells at you for missing it. Lots of hair pulling and frustrated users.
If you are on the cloud then yes we have been having similar issues on Mondays mostly. Ever since Epicor went to the Azure containers for our VMs on the Epicor servers we have had slow downs from time to time. I just put in a ticket every time it happens and hopefully it gets resolved sometime in the near future. Maybe with the upgrade a week from Saturday??
We are on Windows, but not SSO. I’ve tried the smart client and a browser. Both have the issue. It seems to be related to the app calling to the server for the Part’s description. As soon as the PN is entered and we tab to the next field the description is loaded. The lag doesn’t happen with other fields, only PN entry.
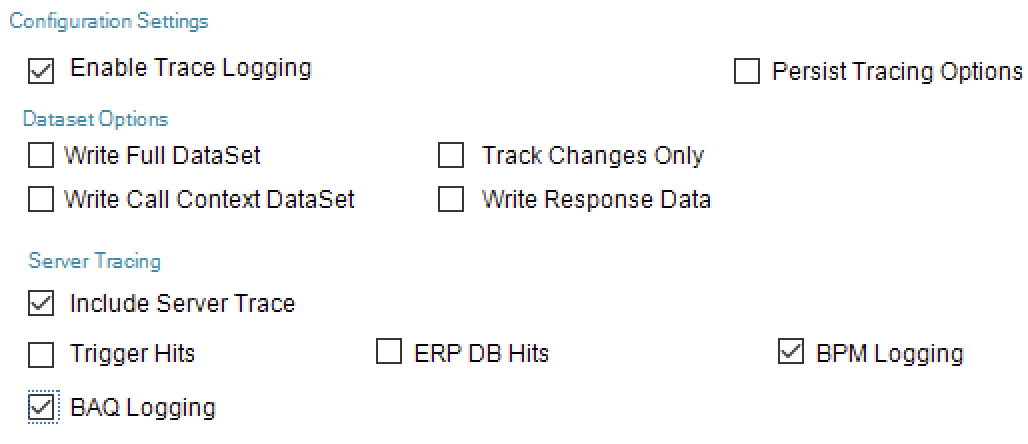
Well, if you can actually access your system at the moment, I would recommend you do a client trace from the smart client and then get the part number. Switches should be as follows:
There’s no company specific BPM that we’ve put on these apps. Would it be a system BPM? (We’ve only been live for 10 months so BPMs are not in our wheelhouse yet)
Unlikely then, but still the server trace is the best place to start. Might be worth including the ERP DB Hits flag as well, to get info on the SQL time.
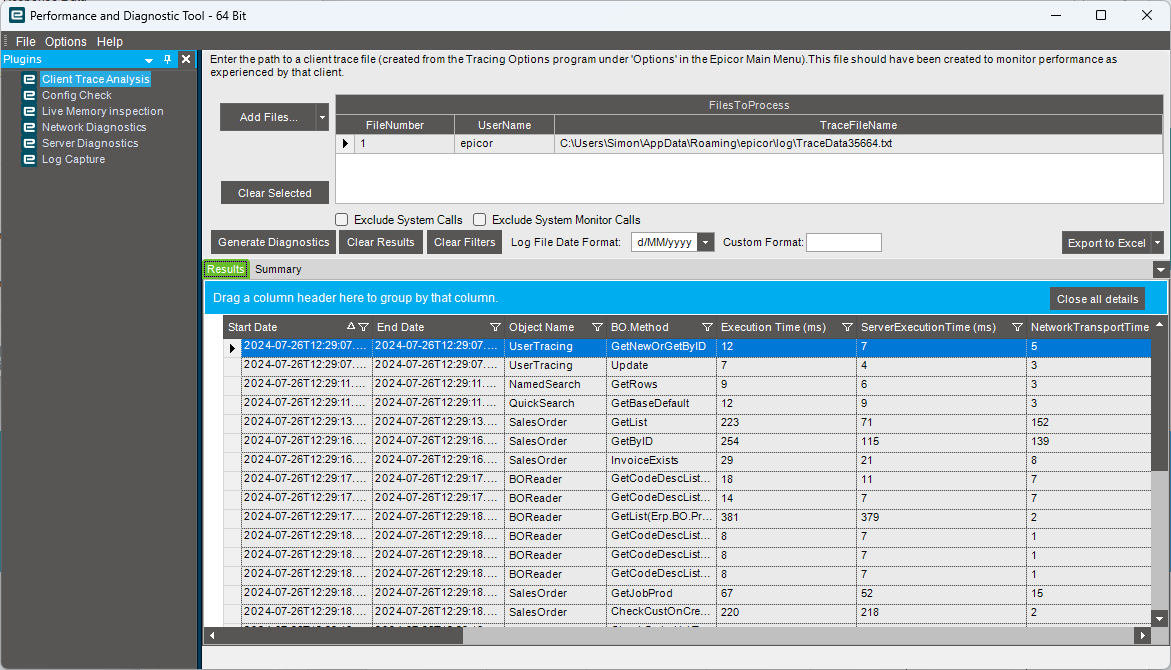
Calls with a high time in them and which elements are ‘slow’. The log will show total time (from the client) there will also be server time and SQL DB time. On the longest calls - which are the lengthy elements?
If you don’t have it already get the PDT tool then you can take your client trace and review all of the methods that are fired and how long each one takes to execute.
I suspect it is something like SalesOrder.OnChangePartNum that is taking the time. Do you have large descriptions?
The other thing I know that people have mentioned compression as well that can be tweaked.
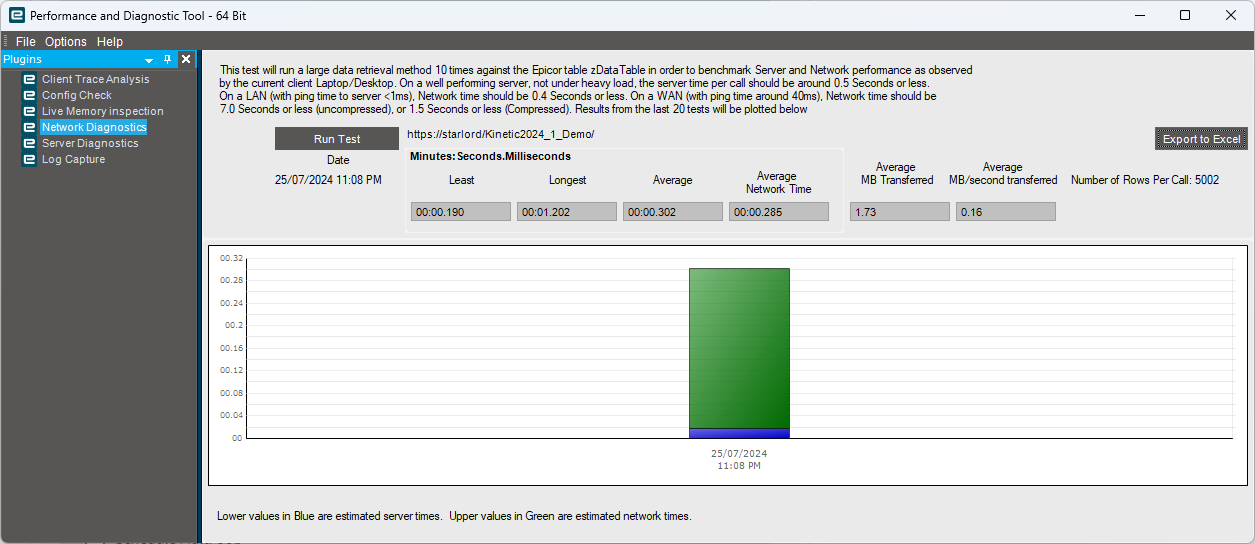
The PDT also gives you the ability to check the network speeds from the client to the server.
There is a whole performance tuning document on Epicweb, as well as the PDT to download and the help inside that app, as well as the help for the Administration Console (Sorry Cloudy folks).
If you are On-Prem then the PDT is there ready to install as part of your install. Just go into EAC connect to your app server and click on the PDT button and it will install… The Installer if you want to install on other machines can be found in the Epcicor\ERP11<version>\Utilities\Performance Diagnostic Tool folder (your version may vary), along with a couple of other useful tools, and some I have never used or have any idea what they are for.
Need any help I am sure I can do simple post on it…if there is not one already there in the experts corner.
Edit
This is what the Network Diag looks like in the PDT
After further review we were able to find a related PRB similar to this scenario, the system is working as designed as the lag you are experiencing is there to prevent serious errors that could occur if the action after loading is not what our users expect. It is indeed possible to change this scenario, but new development and design would be required. If desired, you can submit an enhancement request with the detailed business case to be reviewed by Product Management.
You can always suggest a new feature to be developed.
Please use Epicor Ideas Portal to submit and vote for existing enhancements to increase its priority.
We’re cloud and you can get the PDT. If you’re on Classic UI you can do trace logs with Kinetic I don’t think you can.
Our team reports slowness sometimes when in Customer Shipment Entry. I’ve done several traces as were on Classic UI still. Support has yet to report what’s going on but I suspect I’ll get a similar response.