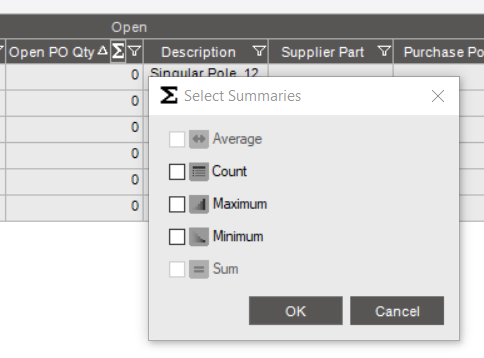
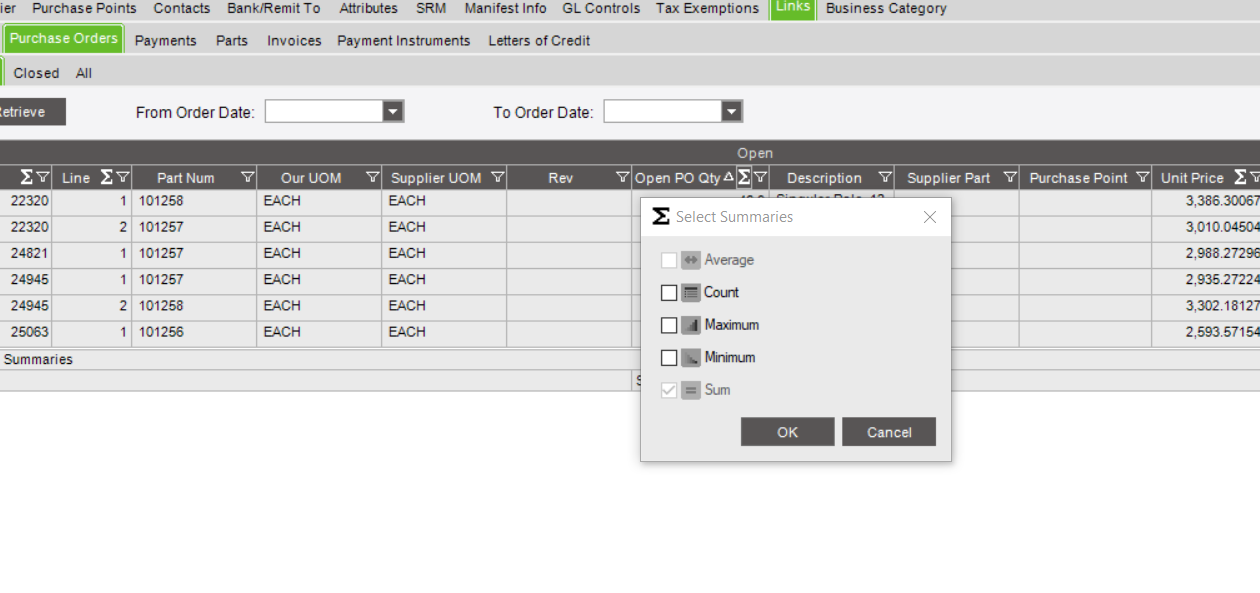
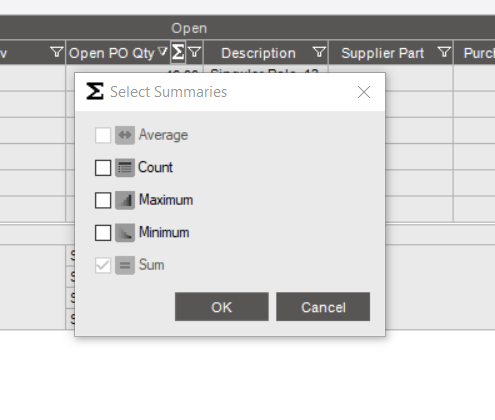
I have an custom section added under Supplier tracker where I could not get Summation for the field. So added this part of code . But have Average and Sum as disabled. Whereas Minimum/Maximum/Count are enabled
What can I code to make Sum enabled under RowSummaries:
I’m assuming your grid is populated by BAQ results. Can you please check the BAQ for the data type of Open PO Qty? If it’s not a numeric type (int, bigint, etc.), that’ll be the cause of the issue. Average and Sum aren’t compatible with nvarchar, which is what I think Open PO Qty is set to.
Try setting it to int and see if that works.
Hi Joe, It is set as decimal. We tried to set datatype within script also. That did not help either
grdOpenPO.DisplayLayout.Bands[0].Columns.Add(“openpoqty”, “Open PO Qty”).DataType = typeof(System.Decimal);
EDIT:
Was wrong about decimal displaying with a decimal place by default if coded in customization, oops. @Mark_Wonsil thank you for the popcorn
Regardless, I believe there’s some sort of data issue with the summary.
Also, is there a reason you’re using decimal over int considering you’re just needing PO quantities? Even in the summary you’ll get a decimal if the data type in the BAQ isn’t set to decimal.
Thanks, I don’t see any issues with it. Sum and average work fine for me, too.
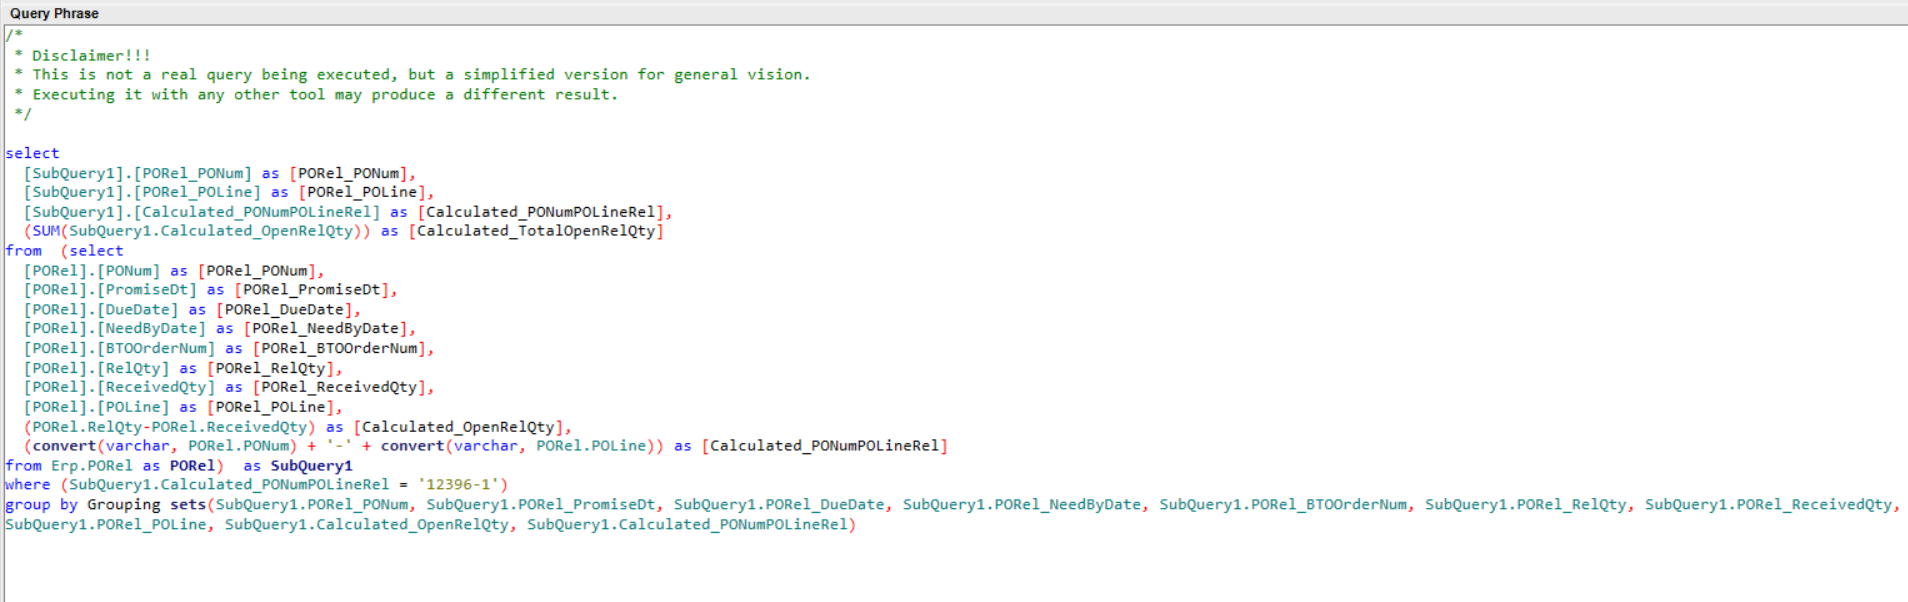
I did notice this BAQ doesn’t match the fields you have in your photo. Did you send the right BAQ? The one you sent deals with PO releases but doesn’t deal with Open POs themselves, unless you renamed the column to Open POs and not Open Releases.
Nothing jumps out at me, though C# isn’t my main language. I’m not sure why it would be greyed out.
This line: listrow.Cells["openpoqty"].Value = Math.Round((decimal)dsQuery.Tables[0].Rows[0]["Calculated_TotalOpenRelQty"], 1, MidpointRounding.AwayFromZero).ToString("N");
should be formatting it to 0.00, yet I don’t see that in your screenshot. Coupled with the greyed sum and average boxes, my assumption is still that it’s something to do with the data in that column.
My only other thought is that something in the rest of the code could be the culprit, but I’m not sure at this point.
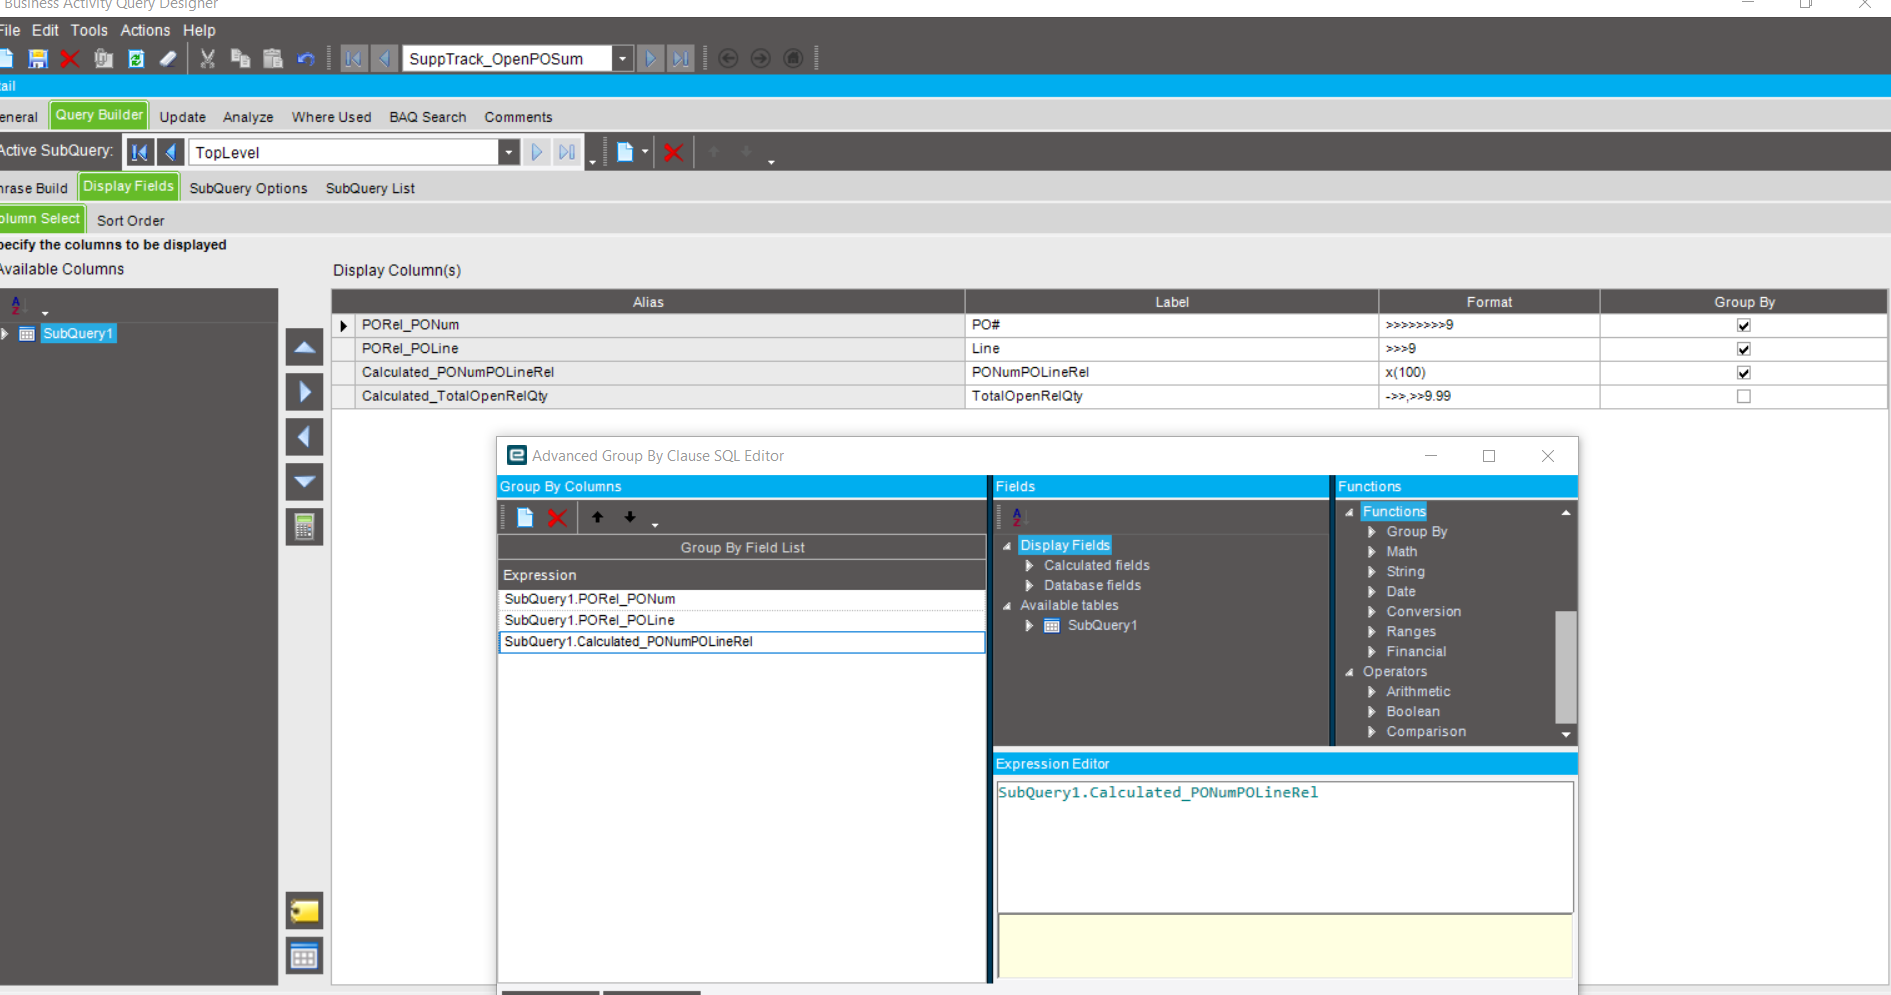
Using advanced Groupings in your BAQ, you could have both the details and the summary in the grid view automatically
Just add a subquery that pulls in the detail subquery and total it based on how you want to see the average and totals.
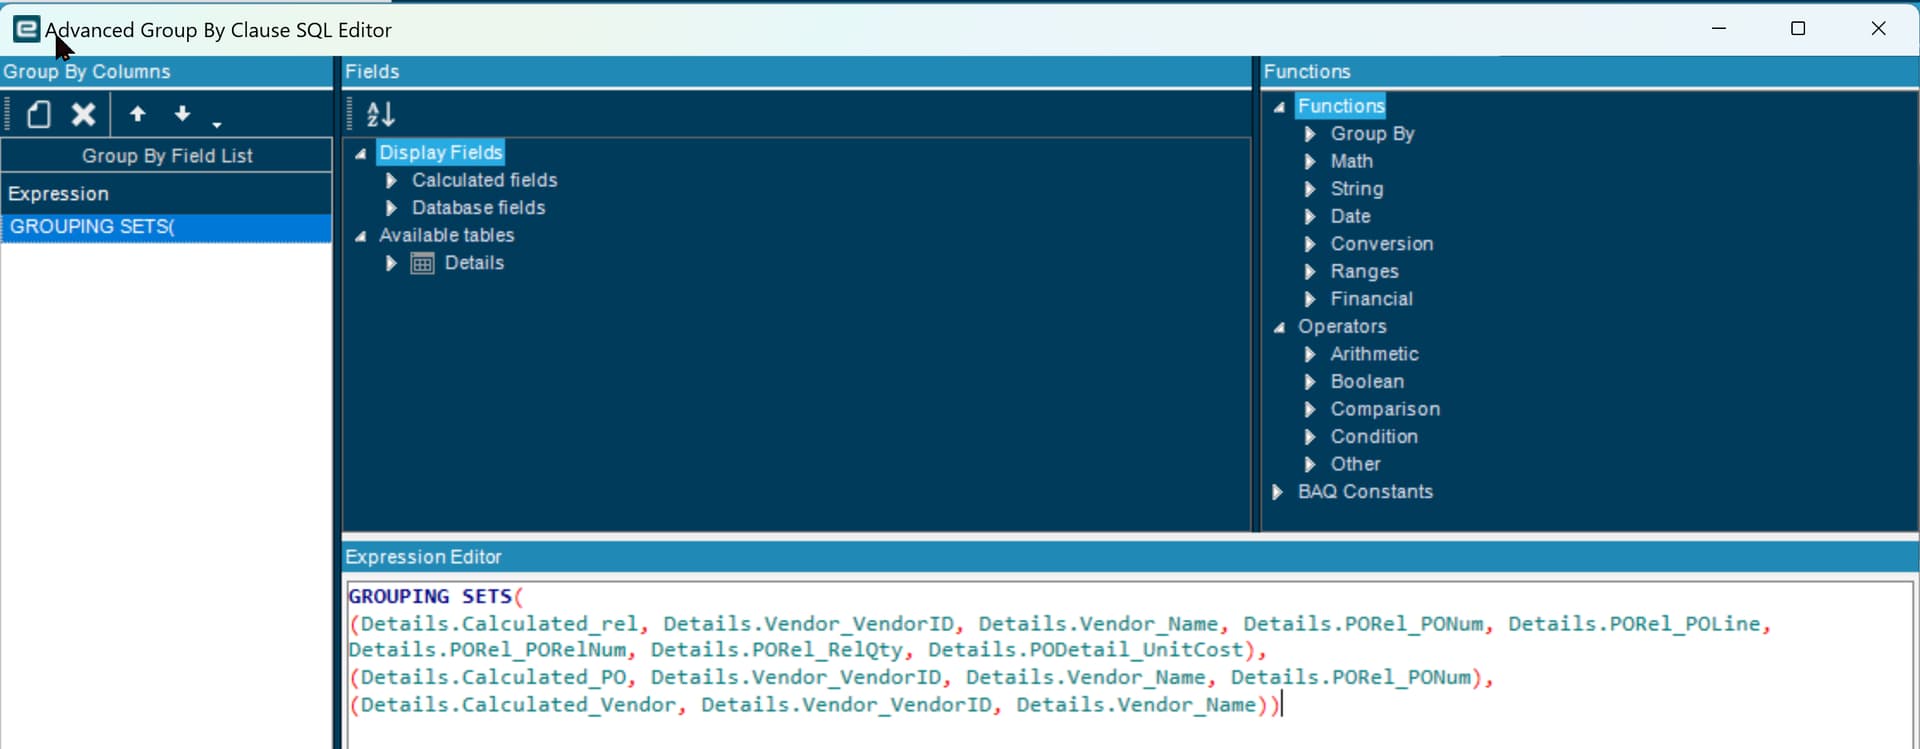
Actually - you can do grouping and subtotals.
Note - I put in the Vendor, PO, and Rel flags to allow easier filtering when you want to show different levels.
 .
.