Diskspd Utility

Has anyone used the diskspd utility to review/measure performance of a disk subsystem - especially for monitoring and performance tuning of SQL Server instances/databases? Too many options. Was trying to find out some good parameters to use for estimating load performance on SQL Server. Have already run the Performance and Diagnostic Tool and modified/made the recommended changes by it. Want to do the same for SQL Server (if possible) before we start off our project.

Please advise.
Thank you,
Jeff Henslee

1 Like

I would start off with recommended Disk configurations for SQL itself, like no RAID-5 and set block size appropriately for large data when formatting it.
Then, there are several good SQL Stress testing utilities that measure performance on a pre-built database to benchmark your server, which I recommend doing.
After that, there are some Epicor White Papers on SQL Performance Tuning that are great as well.

Regards,

George L. Hicks
ERP Solutions Manager
Visionaire Lighting, LLC
PH: (310) 512-6480
Cell: (951) 505-9849
ghicks@visionairelighting.commailto:ghicks@visionairelighting.com
[logo]<visionairelighting.com>

Thank you. I’ll check them out.

Jeff,

I would read a few things first:

http://beeparent.com/index.php/752-using-diskspd-in-sql-server-environments

(this was our main source)

Having read those, here are the commands we would run to attempt to simulate a SQL Server workload on the storage in our Epicor SQL Server environment. I’m a little rusty on the specifics of why each parameter is set the way it is, but we did this with several hardware upgrades over the last few years (SAN → HP Fusion ioDrive → Intel P3700) and it seems to show us performance that is somewhat in line with theoretical specs listed by the manufacturers of the storage hardware.

REM 30/70 read/write, simulating SQL log file?
diskspd.exe -c5G -w70 -b64K -F6 -T1b -s8b -o8 -d120 -h C:\Temp\testfile.dat

REM 70/30 read/write, simulating data access?
diskspd.exe -c5G -d120 -r -w30 -t6 -o32 -b8K -h -L C:\Temp\testfile.dat

REM You may want to change a couple things, like the -F / -t parameters
are # of threads which we have set to # of cores on the SQL VM (6)

May I ask what sort of storage hardware you are testing?

Jeff,

I forgot to mention, another tool we use is ATTO Disk Benchmark.

It’s not as rich in important specs as DiskSpd, but it gives you a quick idea if you have things configured right or not by showing a simple graph of max read/write speeds under different conditions.

Just so you are aware - Epicor Perfomance tuning experts told me about 4 weeks ago they have not yet officially defined Diskspd testing parameters and related output grading. Rather, they still utilize SQLIO as documented in the performance tuning guide to evaluate SQL servers.

1 Like

We are still using SQLIO until a comparative study with diskspd is completed.

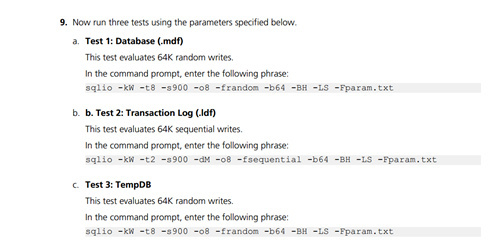
The SQLIO commands / what they are testing per the performance tuning guide:

As long as no one holds this against me [cough @jgiese.wci ], below could be used as a starting point for testing diskspd(terms and conditions apply, YMMV, etc) while we complete testing (but, until we have officially published the parameters to use with diskspd, SQLIO should continue to be used)

NOTE: D drive is the volume that we’ll be testing

For tests 1 and 3:
diskspd.exe -b64K –d900 -o8 -h -L -t8 -r -Z1G –w100 -c80G d:\test\test.dat > test1_3.txt & test1_3.txt

Where
• –d900 is 900 second test duration 0 same as our SQLIO test
• -o8 is 8 outstanding I/Os (depth queue) – same as our SQLIO test
• -h is disable software caching (which all the articles I saw online recommended when testing on SQL server)
• -L is for displaying latency info (info is good)
• -t8 is for 8 threads – same as our SQLIO test
• -r is for random
• -Z1G is for workload test write source buffer size in MB for supplying random data for writes (which is recommended when testing SQL server)
• -w100 is for 100% writes – same as our SQLIO test
• -C80G is for an 80G test file – same as our SQLIO test

For test 2:
diskspd.exe -b64K –d900 -o8 -h -L -t8 -w100 -c80G c:\test\test.dat > test2.txt & test2.txt
Where we are testing sequential writes instead of random

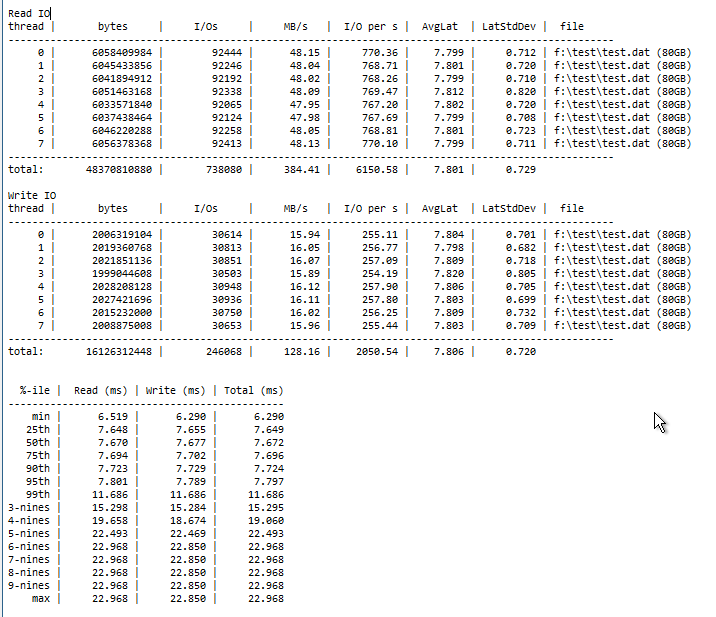
Below are the results of the diskspd command used for test1 & 3 with 75% writes instead of 100% to more closely simulate an OTLP load on an SSD RAID 1 volume for science.

5 Likes

The only thing I hold against you is UD tables in 9.05.604 LOL what a Merry Christmas that was

Has anyone used HammerDB for User Load / Transactional Testing?

As part of this discussion about diskspd, I felt it was time to try to determine which parameters make sense to use based on how Epicor ERP is used in practice.

I’m showing my work so people can poke holes in the approach. If you’re just interested in the results and not the process just skip to the end for the testing parameters that I’ll be submitting to development for inclusion in our guides going forward to replace our guidance to use SQLIO.

First, I needed to find out a way to get database accurate read and write stats of a SQL database and discovered this article: How to get Read/Write percentages for a SQL Server database | The Fisherman DBA .

From that article, this note about his approach:
The stats are cumulative since the last SQL service restart. The longer you wait to run this since the last server reboot or service restart, the more meaningful the stats will be.

Next, I needed some databases to test against and the closest thing to a production database that I have direct access to is well, a number of the customer databases in the Support environment. As these databases were brought in to Support for different reasons across various modules, I figured the stats across these Support loaded customer databases would be appropriately representative. As a bonus, the largest SQL instance we have in Support hasn’t been restarted since October so the results should be meaningful.

Ran the query, put the results into a spreadsheet like so:
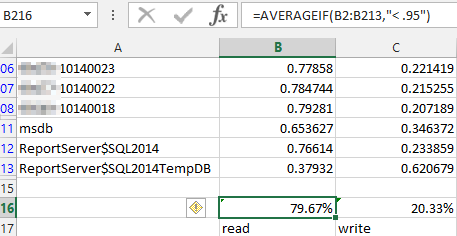
Was only concerned with databases that were accessed and used to some extent (as in, we tested in them) and not those that were just loaded, so averaged the reads if they were less than 95% / writes if they were over 5%.

Drum roll.
Ended up an average of ~80% reads / ~20% writes. We have a result.

NOTE: I repeated this test against a development SQL server instance and the results were similar.


The parameters I’ll be submitting to development for diskspd to replace our recommendation to use SQLIO

DISKSPD COMMAND FOR TEST 1 AND 3 (transactional database MDF and TempDB):
diskspd.exe -b64K –d900 -o8 -h -L -t8 -r -Z1G –w20 -c80G d:\test\test.dat > test1_3.txt & test1_3.txt

Where
• –d900 is 900 second test duration - same as our SQLIO test
• -o8 is 8 outstanding I/Os (depth queue) – same as our SQLIO test
• -h is disable software caching (which all the articles I saw online recommended when testing on SQL server)
• -L is for displaying latency info (info is good)
• -t8 is for 8 threads – same as our SQLIO test
• -r is for random
• -Z1G is for workload test write source buffer size in MB for supplying random data for writes (which is recommended when testing SQL server)
-w20 is for 20% writes – based on analysis of internal usage of customer database
• -C80G is for an 80G test file – same as our SQLIO test

DISKSPD COMMAND FOR TEST 2 (SQL transaction log .LDF):
diskspd.exe -b64K –d900 -o8 -h -L -t8 -w100 -c80G c:\test\test.dat > test2.txt & test2.txt

6 Likes