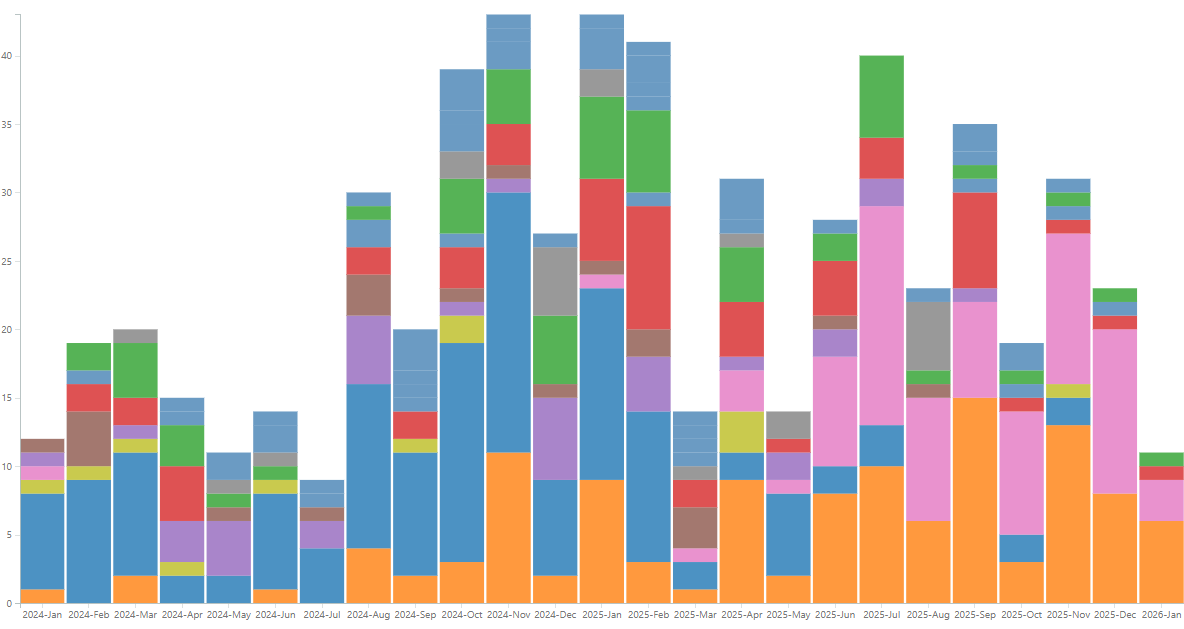
Highlight is the ticket for colors. EDD’s not great, but for mediocre users you can make some basic stuff. Once you get the hang of it it’s not too bad. Can copy and make different variations of reports.
You can toggle the transaction details and grab all the data into excel quickly too.
You know what Epicor should do with their AI? Have it make ETLs (extract, transfer, load, aka process ahead of time and store, BI speak) for long running queries that make up stuff like this for EDD. Because @amurdock is right, running direct queries for BI insights isn’t really very efficient, so some “ahead of time” processing could be done to make this more possible. Executive queries were an attempt and doing the ETL process, but it was a challenge to understand how it was working.
Seems like AI could be used to analyze a single level query, break it into pieces and temp tables, then store that configuration for use in something like EDD. So you’d end up with something like Grow light.
or.. just use it so people can ask it stupid questions that give you no actionable answers. You do you.
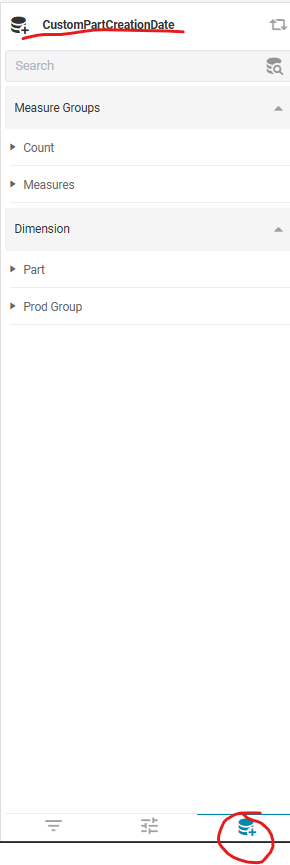
I’ve only used the “canned” EDD cards/charts/whatever you call them. I attempted to work with it a couple of times but realized I have to pick my battles on the new things I learn…
Let’s go Patrick! I forgot you had experience in this. Thanks for taking the time to show it off @pewerth ! Now I know who to come to with EDD questions!
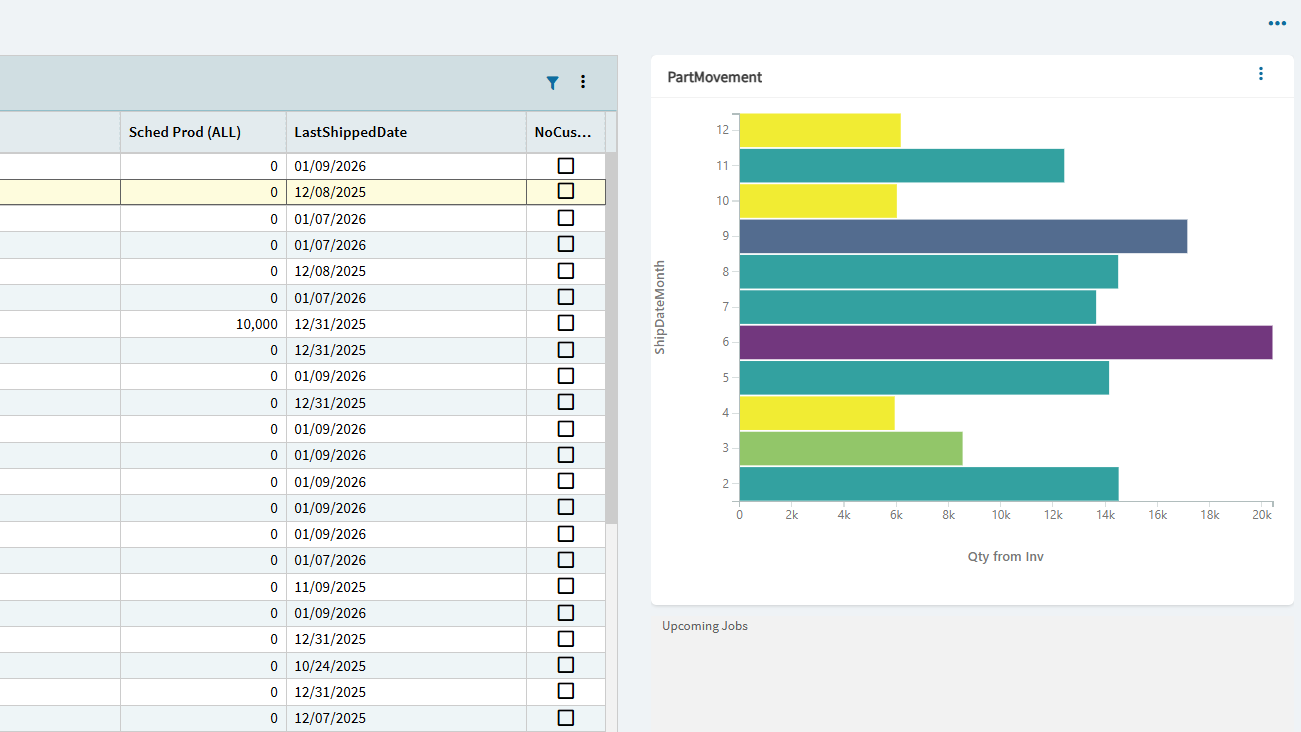
Same. We don’t use it for any real analysis. We have some views built just for quick glance from Kinetic homepages. Mainly for those that don’t have access to Tableau.
I’ve been using EDD since 2022. Its abandonware. Virtually no changes since then and they have the audacity to offer an ‘advanced’ version. I used to have to submit a support ticket weekly at one point because it keep shutting off. Once you understand how to properly fight it into submission its not totally unusable. But this crowd will never be impressed with its rigidity.
Look at it this way, it’s nearly as appropriate a tool for management interaction as R’s barplot(). Except that R is free, and less effort, and presentation (I can’t believe I’m saying this) is more flexible.
Despite statements to the contrary, that is the impression that I’ve gotten so far too. I can’t remember the last time I saw a new feature or change. And AFAIK, it’s still not available for all Epicor Cloud customer environments either (without extra charges).
To make it generally decent and viable, what I’d like to see at a minimum is:
Consolidation of the EDD tables/data into the primary Kinetic DB. It’s a PITA having them separate and the export/import processes are painful. It would be far better if everything was consolidated into the main Kinetic DB for backups and environment refreshes too. An ‘EDD’ DB schema (i.e. instead of ERP, ICE, Ecf, ect.) could be used to effectively still keep it simple too if separation is desired.
Automatic EDD deployment with the main Kinetic Application Server. Similar to how the Swagger components are. And pre-configured/automatically configured.
Automatic deployment for ALL Epicor Cloud environments.
Some improvements, such as at least color palate configuration options.
Hopefully something can happen soon with this, and or BoldReports can be implemented to enable rich visual graphs to be properly embedded into Kinetic forms as we could do within the Classic/WinForms context soon… I think the Kinetic UIs unfairly cop a lot of criticism but in this case, I think that this IS still a very large and clear gap.
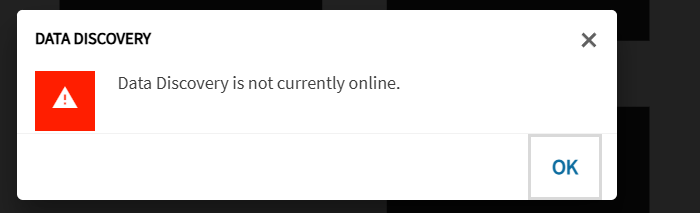
Some more thoughts for anyone seeking knowledge. EDD went down again. I’ll post back with Epicor’s time to resolution.
I saw some extensive epicor demos yesterday. They showcased Grow BI quite a lot, when asked on how these BIs will live side by side, they gave the whole “different use cases” speal . Though, even they weren’t convinced of that.
Just dropping a note that i was incredibly frustrated by Epicor’s graphing/charting solutions that i did some digging, and…
A creative use of a row-update to run a javascript expression that overlays a div on the active window, in which you feed it data from a dataview in json format with json.stringify, and dynamically a draw a graph on screen based on dataview data, that dynamically updates by replacing the div id on a dataview update etc.. you can anchor it to your object of choice on screen (so you can set up an empty container to hold it)
I’ve done it, but it’s such a wildly unsupported solution it was just for funsies. but jus’ sayin’, there’s that.
Could you post a snippit/example of said Javascript expression? What row would be updated with row-update? This seems like a more fun solution than dealing with EDD
I worked with a consultant once who was color blind and he made the mistake of telling us. We had an excel spreadsheet that we highlighted the two colors he couldn’t see. It was hilarious.