Below is the example that I promised.
Note that this graph is specific to the data below, referencing specific columns in the data to establish the axes.
There would be a non-trivial amount of work to do to make this adaptable to a generic dataset, there needs to be some additions to allow the user to define which column maps to which axis, etc.
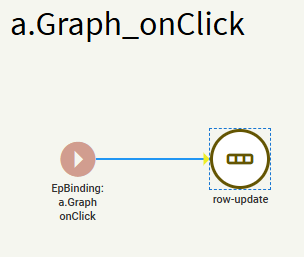
This is accomplished by drawing SVG objects in a div on screen, which can be anchored to any existing object. You can leave an empty container in a dashboard to receive the graph/chart. You can create any sort of chart (pie chart, etc.)
The browser is really quite flexible with Epicor, you just need to beat it into submission appropriately, with a feather.
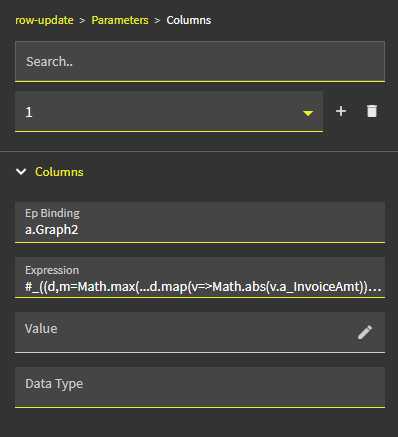
#_((d,m=Math.max(...d.map(v=>Math.abs(v.a_InvoiceAmt))))=>document.body.insertAdjacentHTML('beforeend',`<div style="position:fixed;top:10%;left:10%;z-index:9999;background:#fff;padding:20px;box-shadow:0 0 15px #0005;border-radius:8px;font-family:sans-serif" onclick="this.remove()"><h3>Invoices</h3><svg width="600" height="400">${d.map((v,i)=>`<rect x="${50+i*(500/d.length)}" y="${350-(Math.abs(v.a_InvoiceAmt)/m)*300}" width="${500/d.length-5}" height="${(Math.abs(v.a_InvoiceAmt)/m)*300}" fill="#4a90e2"><title>${v.b_Name}: ${v.a_InvoiceAmt}</title></rect>`).join('')}<line x1="50" y1="350" x2="550" y2="350" stroke="#000"/><line x1="50" y1="50" x2="50" y2="350" stroke="#000"/></svg><div style="font-size:10px;color:#666;text-align:right">Click to close</div></div>`))(trans.dataView('t').viewData)_#
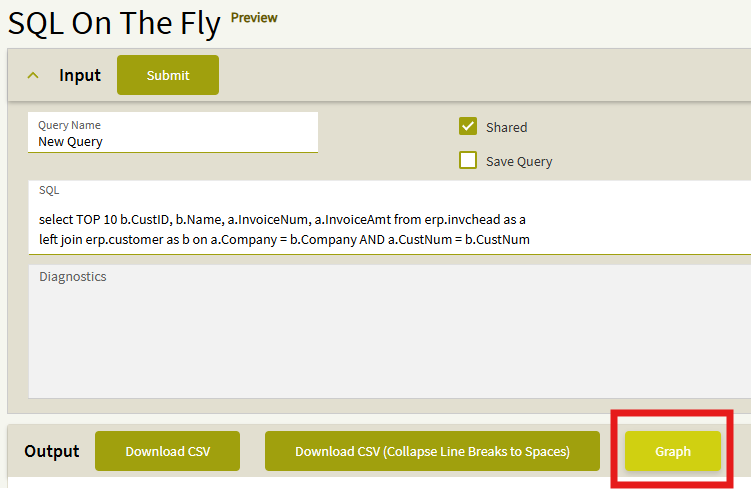
The specific piece of this that exposes rows and columns of a dataview in JSON format is:
trans.dataView('t').viewData
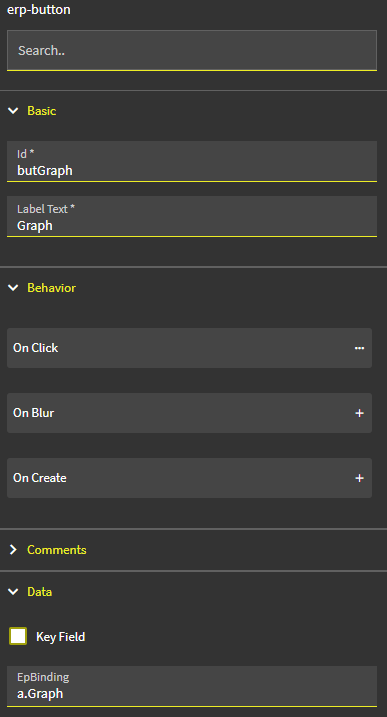
“t” is the name of my dataview.
Maybe I’ll ask Epicor if I can do a presentation at insights on this. I don’t know how popular i’d be on replacing their modules…

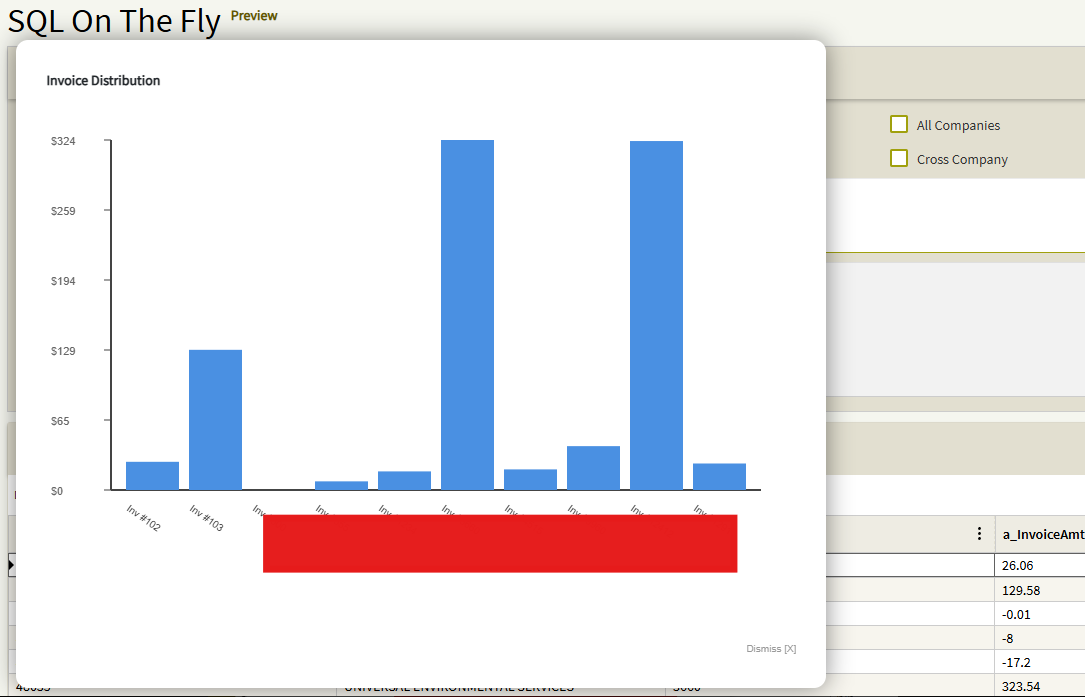
You may get creative and add axis indicators and labels to it as well.
((d,m=Math.max(...d.map(v=>Math.abs(v.a_InvoiceAmt))))=>document.body.insertAdjacentHTML('beforeend',`<div style="position:fixed;top:5%;left:5%;z-index:9999;background:#fff;padding:30px;box-shadow:0 0 25px #0007;border-radius:12px;font-family:sans-serif" onclick="this.remove()"><h3>Invoice Distribution</h3><svg width="750" height="500" style="overflow:visible"><line x1="65" y1="400" x2="715" y2="400" stroke="#444" stroke-width="2"/><line x1="65" y1="50" x2="65" y2="400" stroke="#444" stroke-width="2"/>${[0,1,2,3,4,5].map(i=>`<line x1="58" y1="${400-i*70}" x2="65" y2="${400-i*70}" stroke="#444"/><text x="5" y="${405-i*70}" font-size="11" fill="#666">$${((m/5)*i).toFixed(0)}</text>`).join('')}${d.map((v,i)=>`<g><rect x="${80+i*(630/d.length)}" y="${400-(Math.abs(v.a_InvoiceAmt)/m)*350}" width="${630/d.length-10}" height="${(Math.abs(v.a_InvoiceAmt)/m)*350}" fill="#4a90e2"><title>${v.b_Name}</title></rect><text x="${80+i*(630/d.length)}" y="420" font-size="10" fill="#333" transform="rotate(35,${80+i*(630/d.length)},420)">Inv #${v.a_InvoiceNum}</text></g>`).join('')}</svg><div style="margin-top:50px;text-align:right;color:#999;font-size:10px">Dismiss [X]</div></div>`))(trans.dataView('t').viewData)
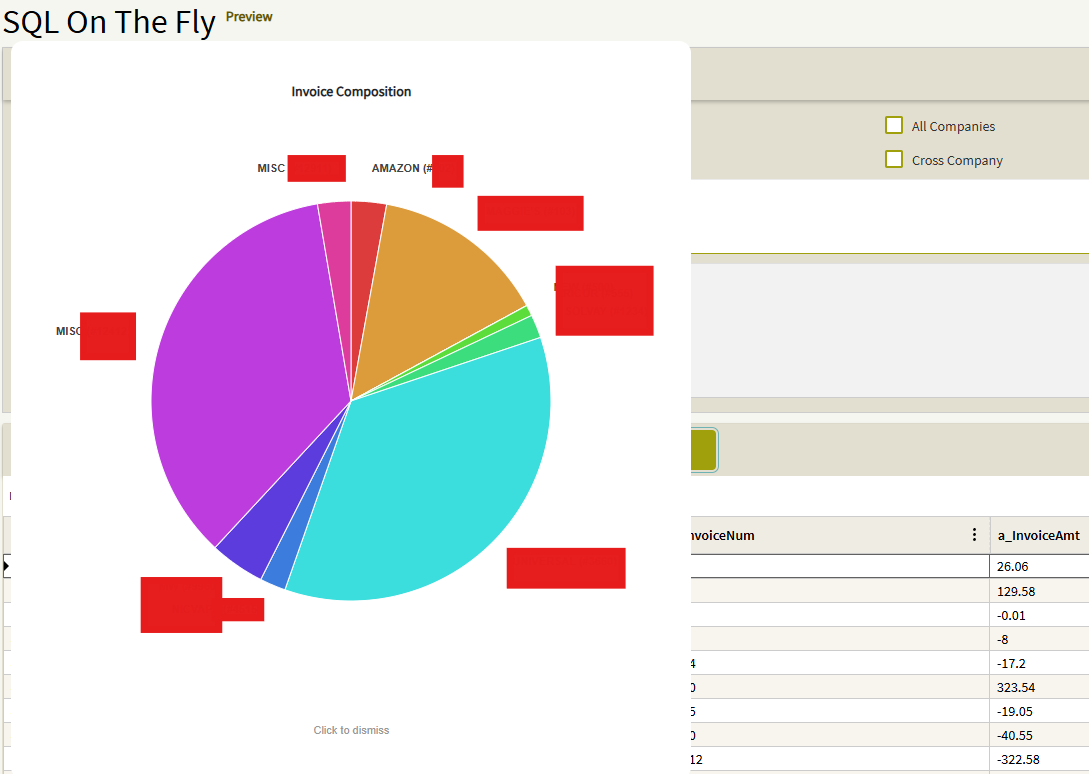
You may do pie charts and any other sort of graphs you like. The world is your oyster with the dataview in json format.
((d,s=d.reduce((a,v)=>a+Math.abs(v.a_InvoiceAmt),0),c=0)=>document.body.insertAdjacentHTML('beforeend',`<div style="position:fixed;top:5%;left:5%;z-index:9999;background:#fff;padding:40px;box-shadow:0 0-25px #0007;border-radius:12px;font-family:sans-serif;text-align:center" onclick="this.remove()"><h3>Invoice Composition</h3><svg width="600" height="600" viewBox="-300 -300 600 600" style="overflow:visible">${d.map((v,i)=>{const p=Math.abs(v.a_InvoiceAmt)/s,a1=c*2*Math.PI-Math.PI/2,a2=(c+p)*2*Math.PI-Math.PI/2,x1=200*Math.cos(a1),y1=200*Math.sin(a1),x2=200*Math.cos(a2),y2=200*Math.sin(a2),la=p>0.5?1:0,clr=`hsl(${i*360/d.length},70%,55%)`;c+=p;return `<g><path d="M0 0 L${x1} ${y1} A200 200 0 ${la} 1 ${x2} ${y2} Z" fill="${clr}" stroke="#fff" stroke-width="1"><title>${v.b_Name}: ${v.a_InvoiceAmt}</title></path><text x="${230*Math.cos(a1+p*Math.PI)}" y="${230*Math.sin(a1+p*Math.PI)}" font-size="11" font-weight="bold" text-anchor="${Math.cos(a1+p*Math.PI)>0?'start':'end'}" fill="#444">${v.b_Name.split(' ')[0]} (#${v.a_InvoiceNum})</text></g>`}).join('')}</svg><div style="margin-top:20px;color:#999;font-size:11px">Click to dismiss</div></div>`))(trans.dataView('t').viewData)