*** Data Discovery widgets appear to be gone in 2024.2 in favor of Grow ¯\_(ツ)_/¯ ***
Epicor Data Discover Variation
Proooooooobably what you should do, but the other one was more fun?
Create your Exploration View in EDD
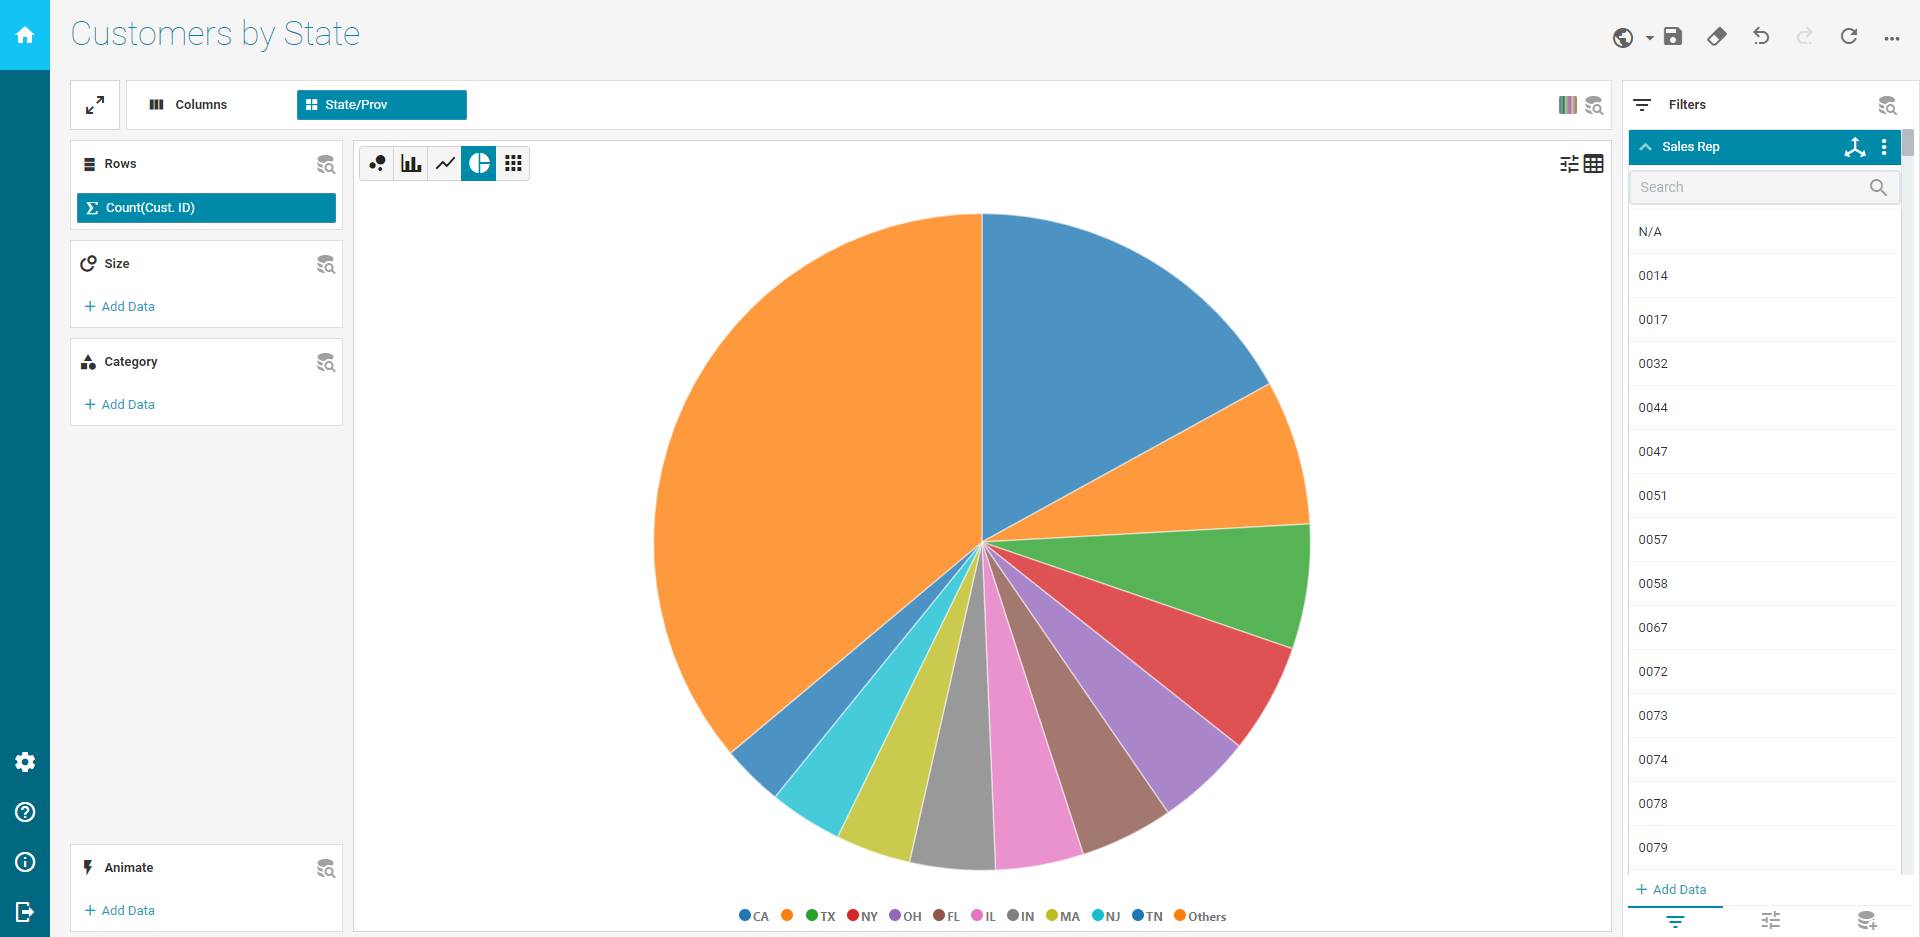
Add a panel card, column and Data Discovery Chart.

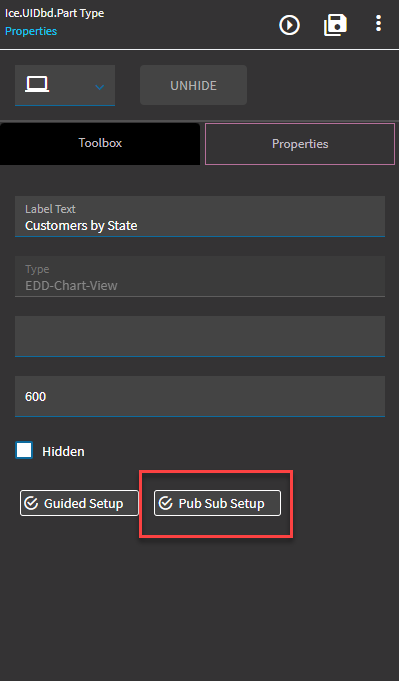
Click the Pub Sub Setup on the properties of the EDD Widget.
Add a new filter.
Subscriber This is the column your data is going to be filtered by in the BAQ
Publisher This is the field being pushed to the filter. Here’s a note, however–the fields at the bottom, bound to your dataview will publish when you click a line from the grid which is going to exclude “All”. To skirt around this, I set mine to CallContextBpmData.Character01 and set the field in an event.
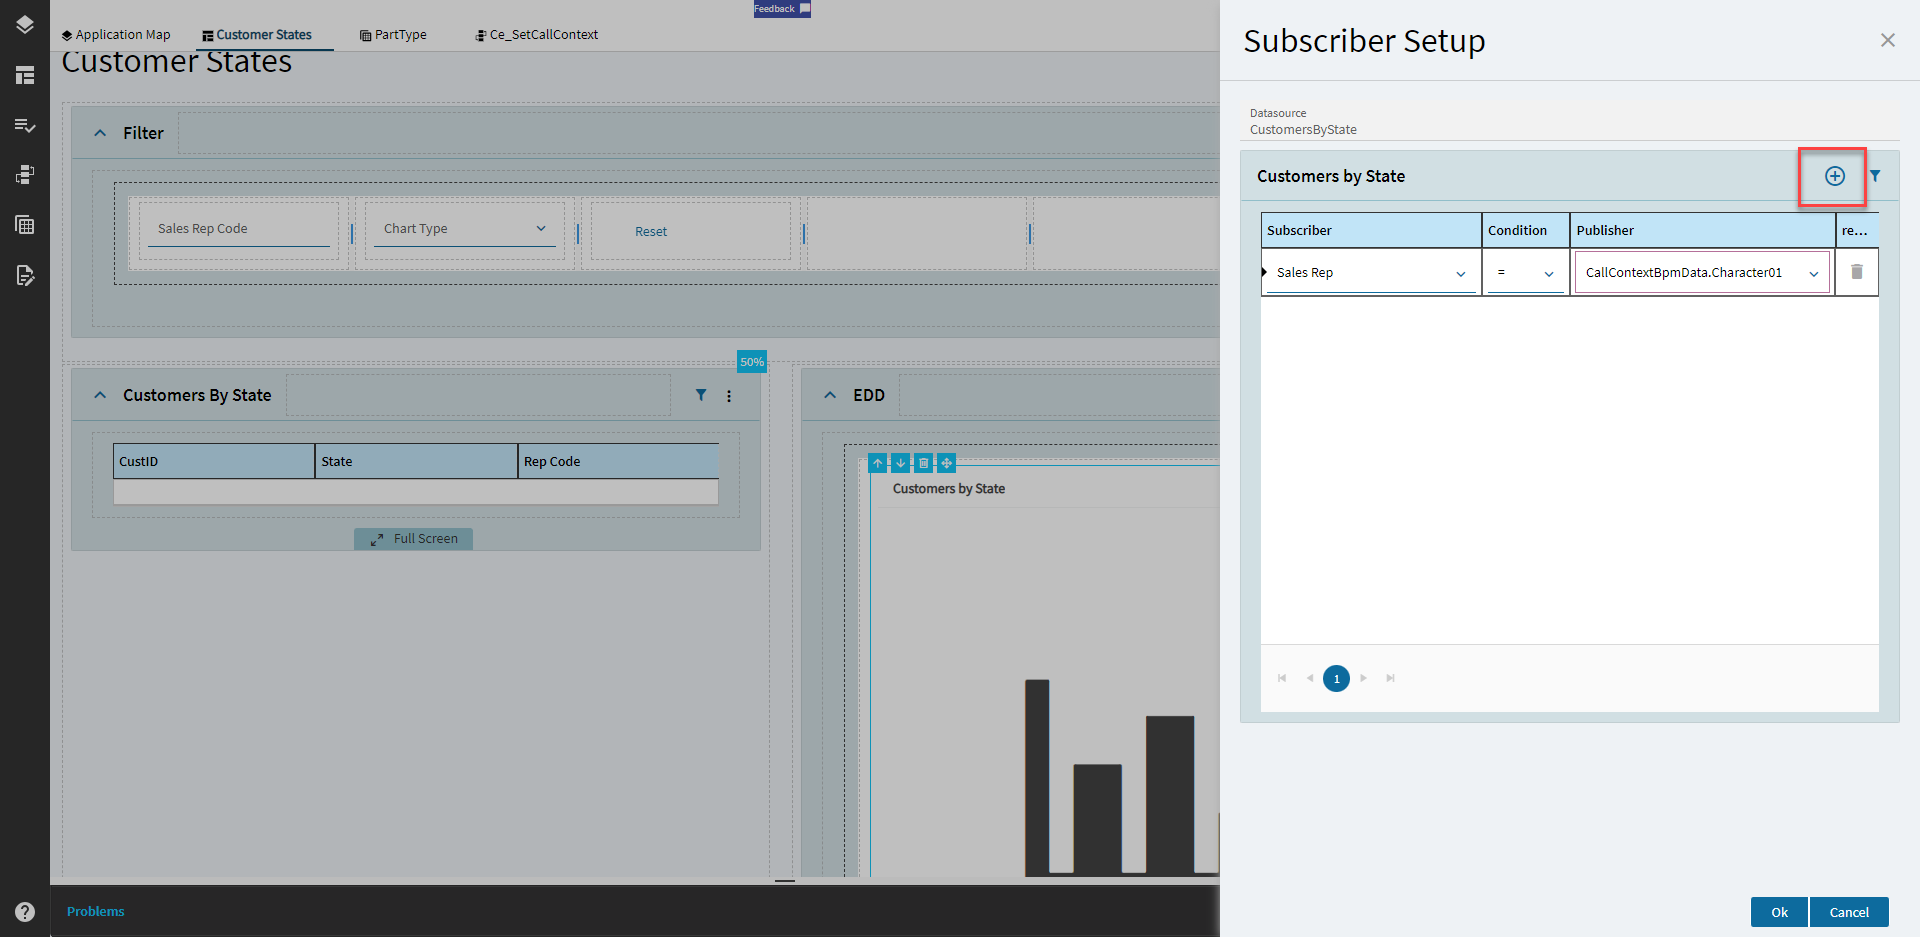
Here’s my filter field. Yes–it says Part_PartNum, but is actually the sales rep. Again–I was too lazy to refactor it.

Create an event to trigger off of your filter field changing.
Type DataTable
Hook Column Changed
Target cdv_Tracker (the dataview your filter field is bound to)
Columns Part_PartNum (the column your filter field is bound to)
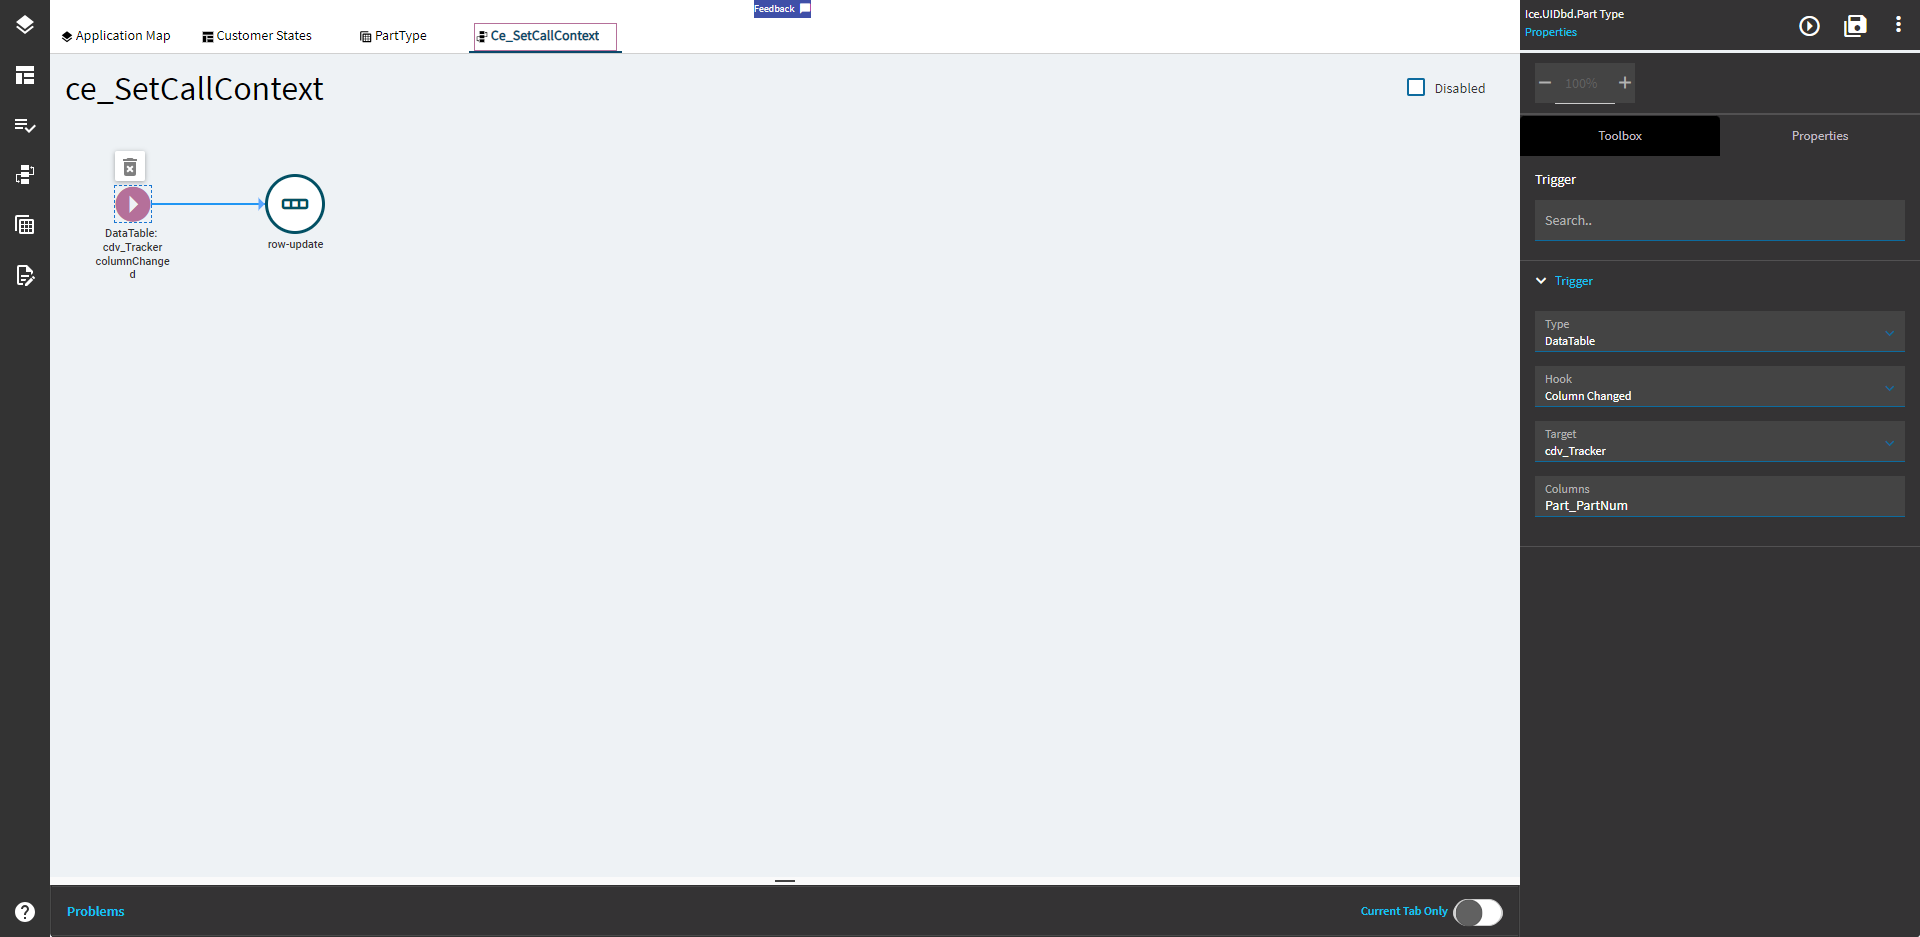
Then use a row-update to set the callContext to your field’s binding.
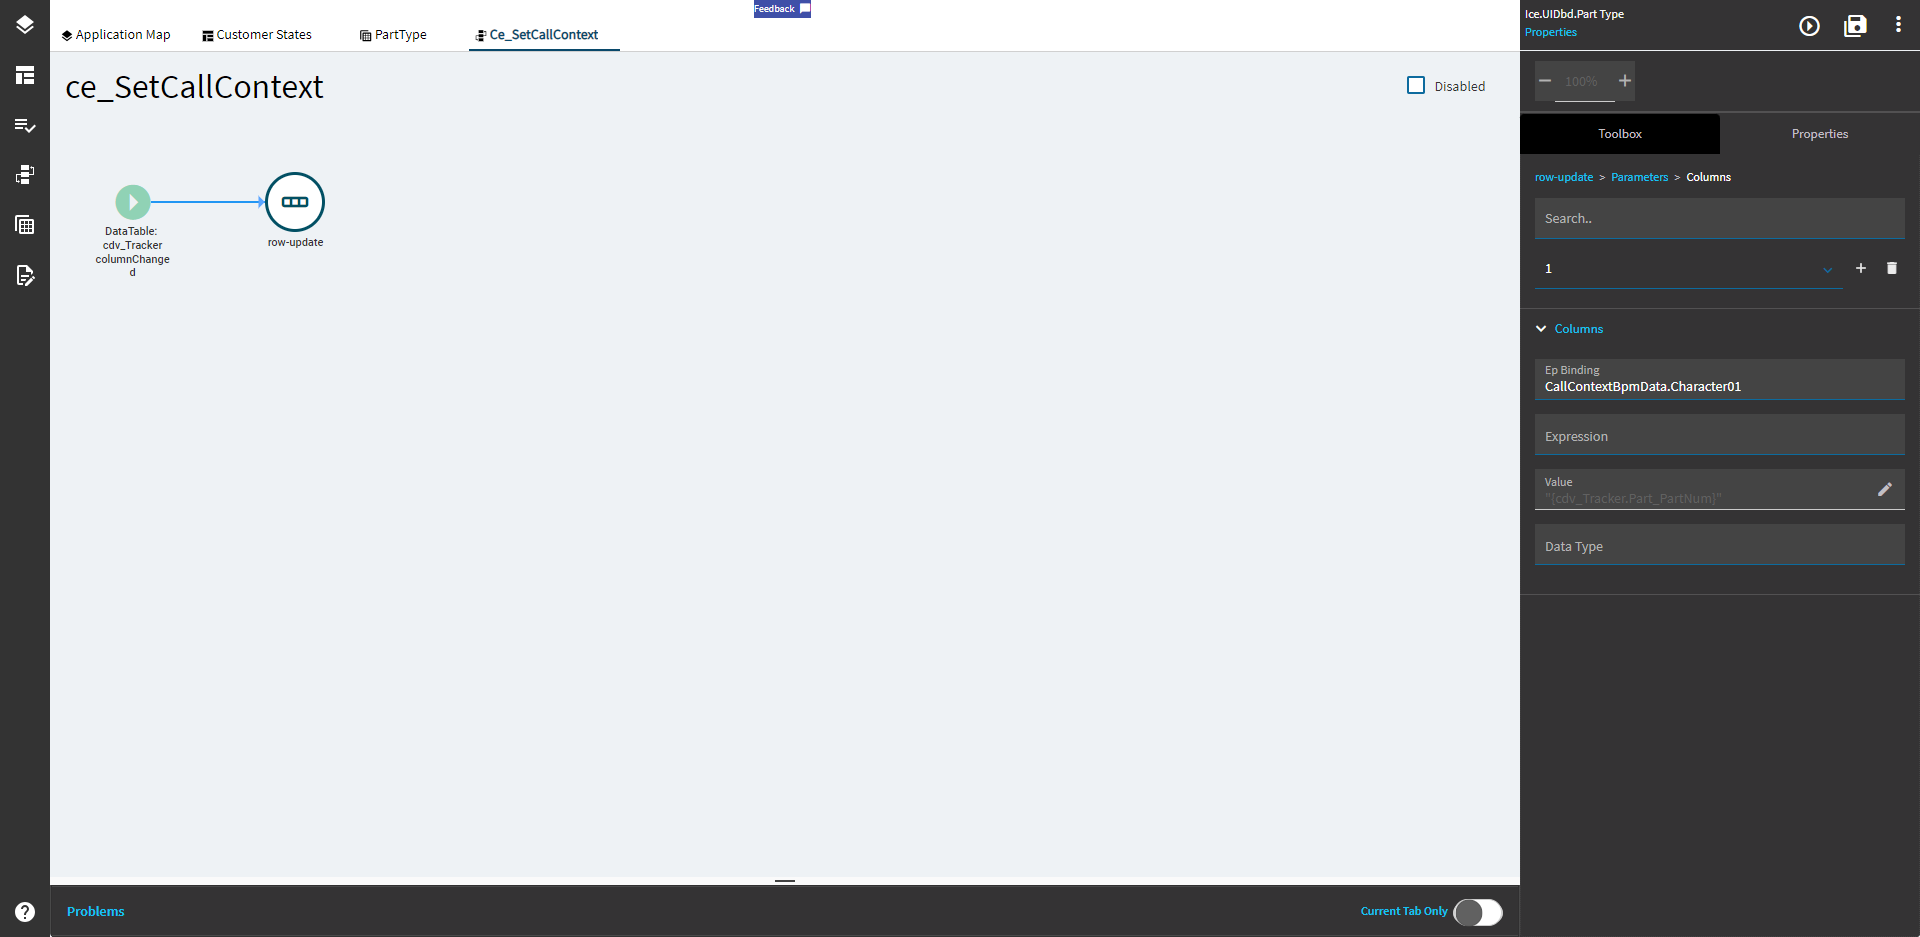
Annnnnnnnnnnnnnnd charting!
This is now… charted territory.