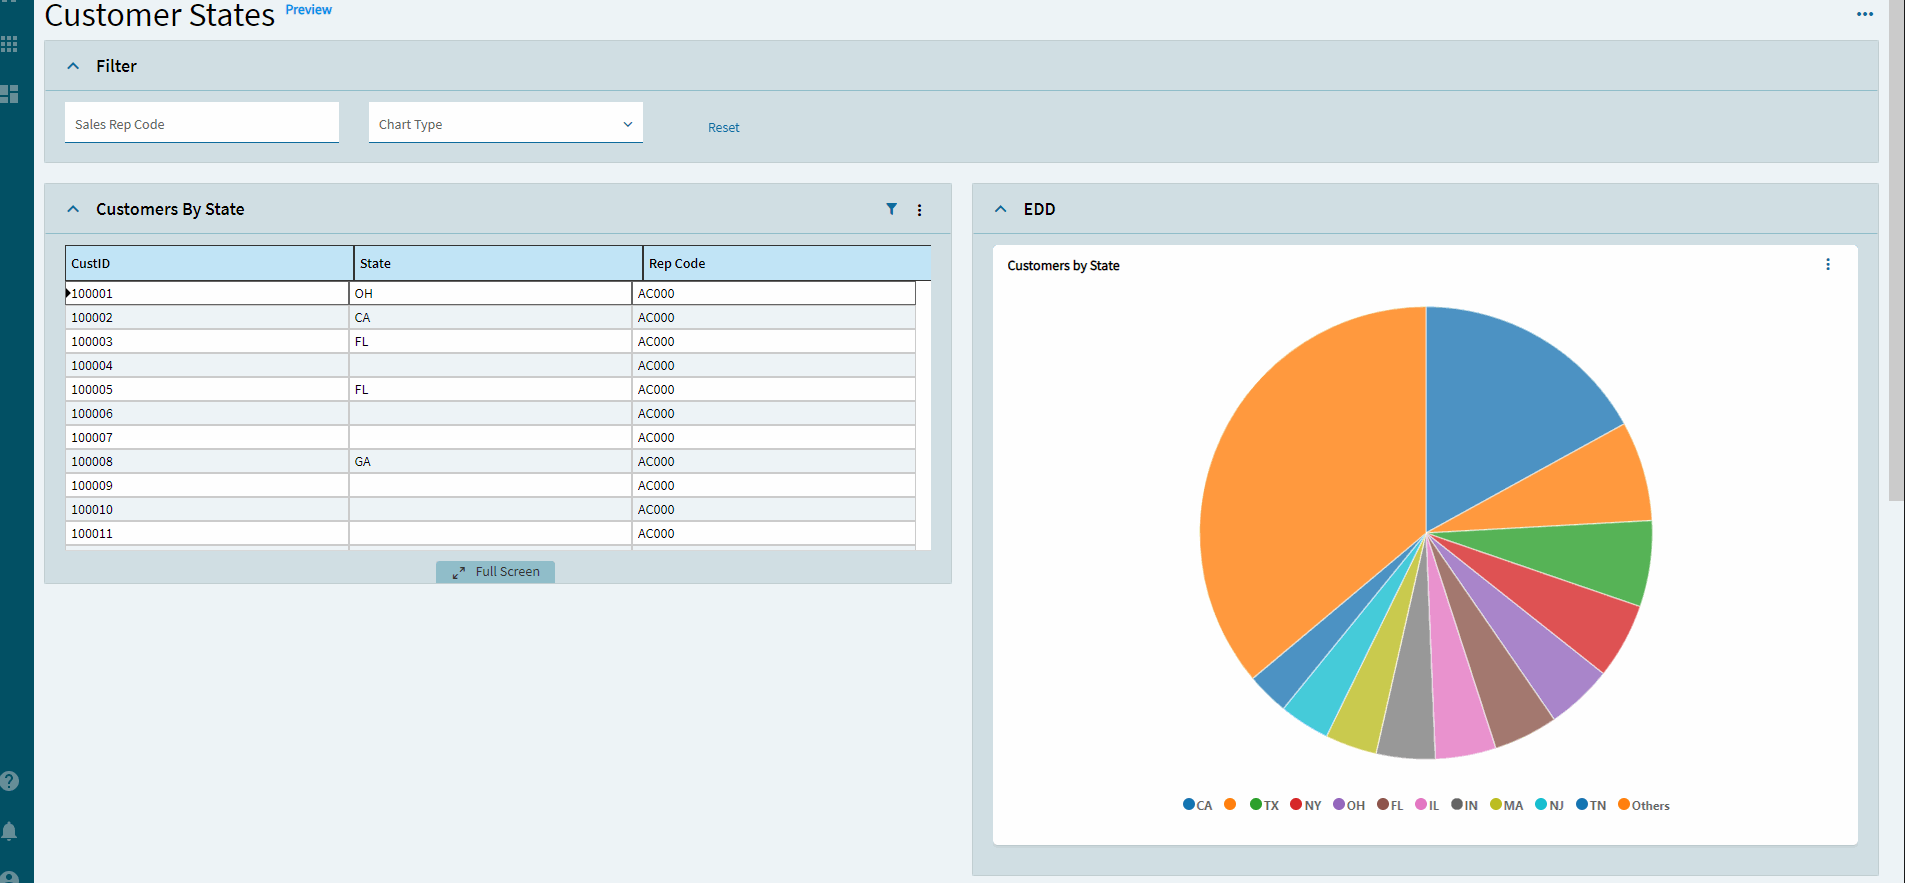
Data Discovery Variation
How To: Dashboard Charts - Experts’ Corner - Epicor User Help Forum (epiusers.help)
Do this one ![]()
Image-Charts Variation
This one is more hacky, but neat.

Well, after playing with this for a bit, I have one solution for getting charts in dashboards (or elsewhere).
@josecgomez is going to waltz in here yakking about getting Data Discovery to work. WHATEVER JOSE. My way is still neat. I was also lazy/annoyed at the DataTable.ViewChanged trigger not working, so this hinges off of a button at the moment.
Let’s get into it!
Do your thing to create a dashboard/app/whatever; I’m not going to get into that as there are other posts you can follow.
First up–add 2 new DataViews.
cdv_Chart to bind the URL to
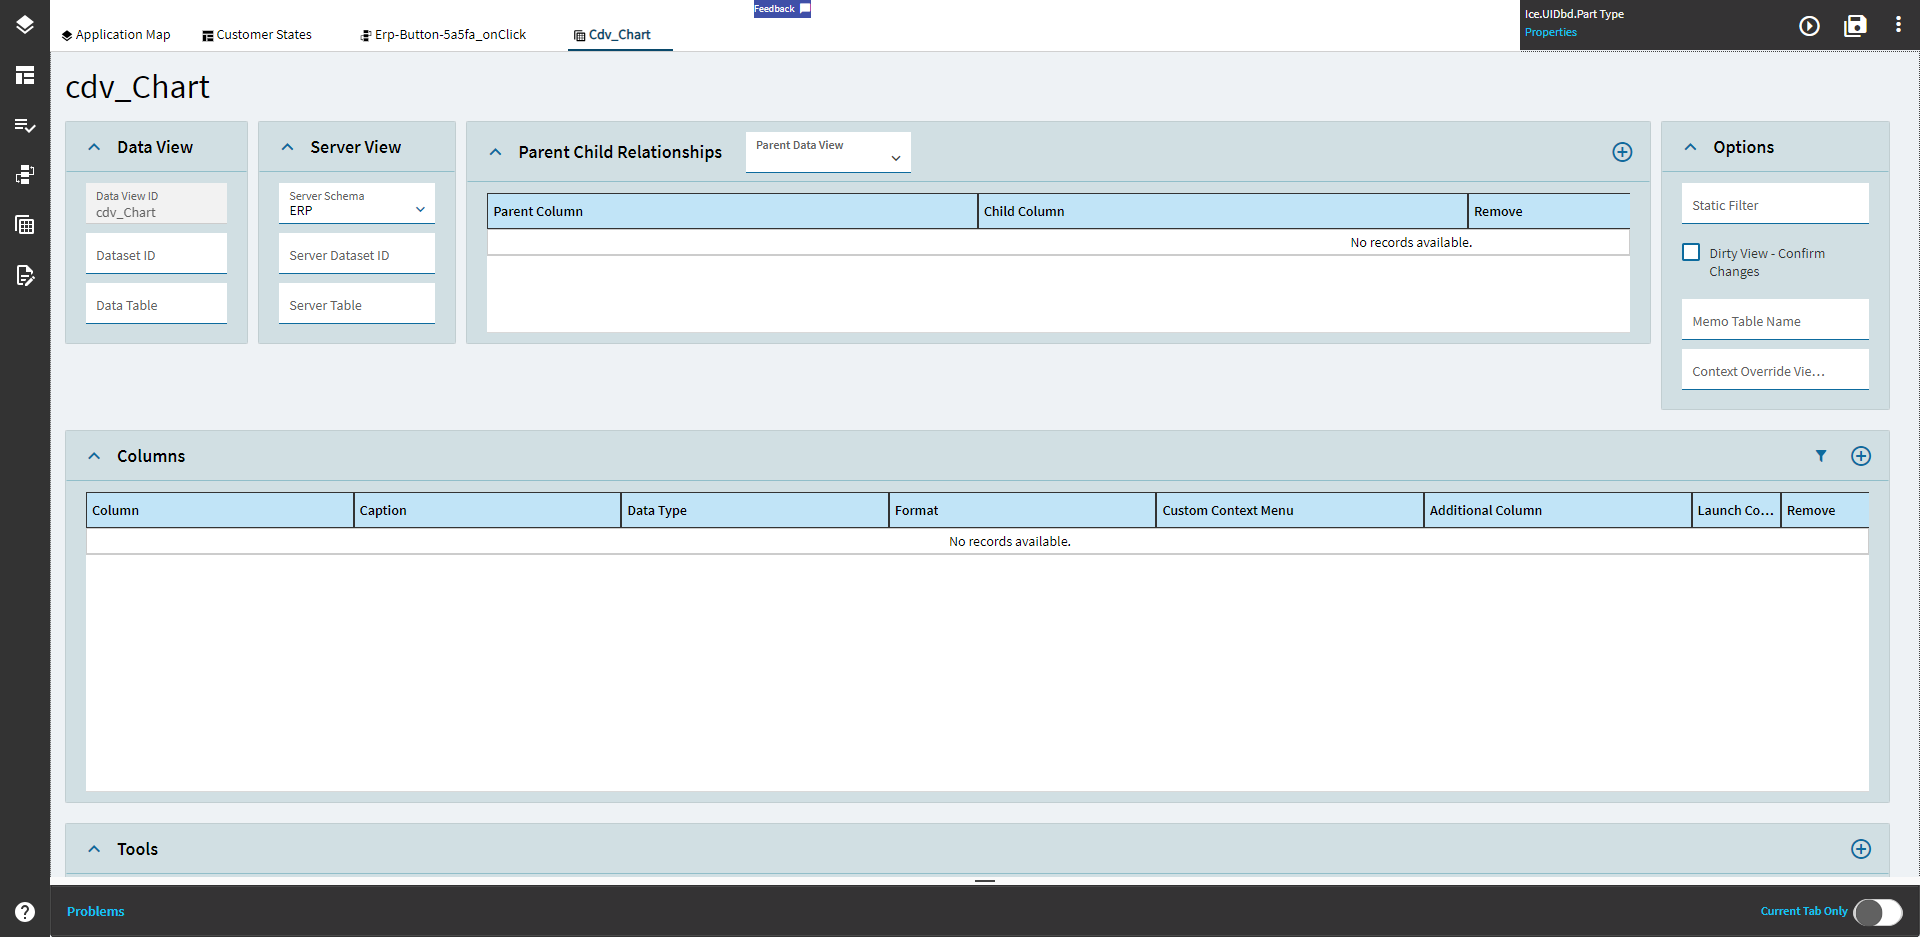
cdv_Tracker to bind the tracker fields to

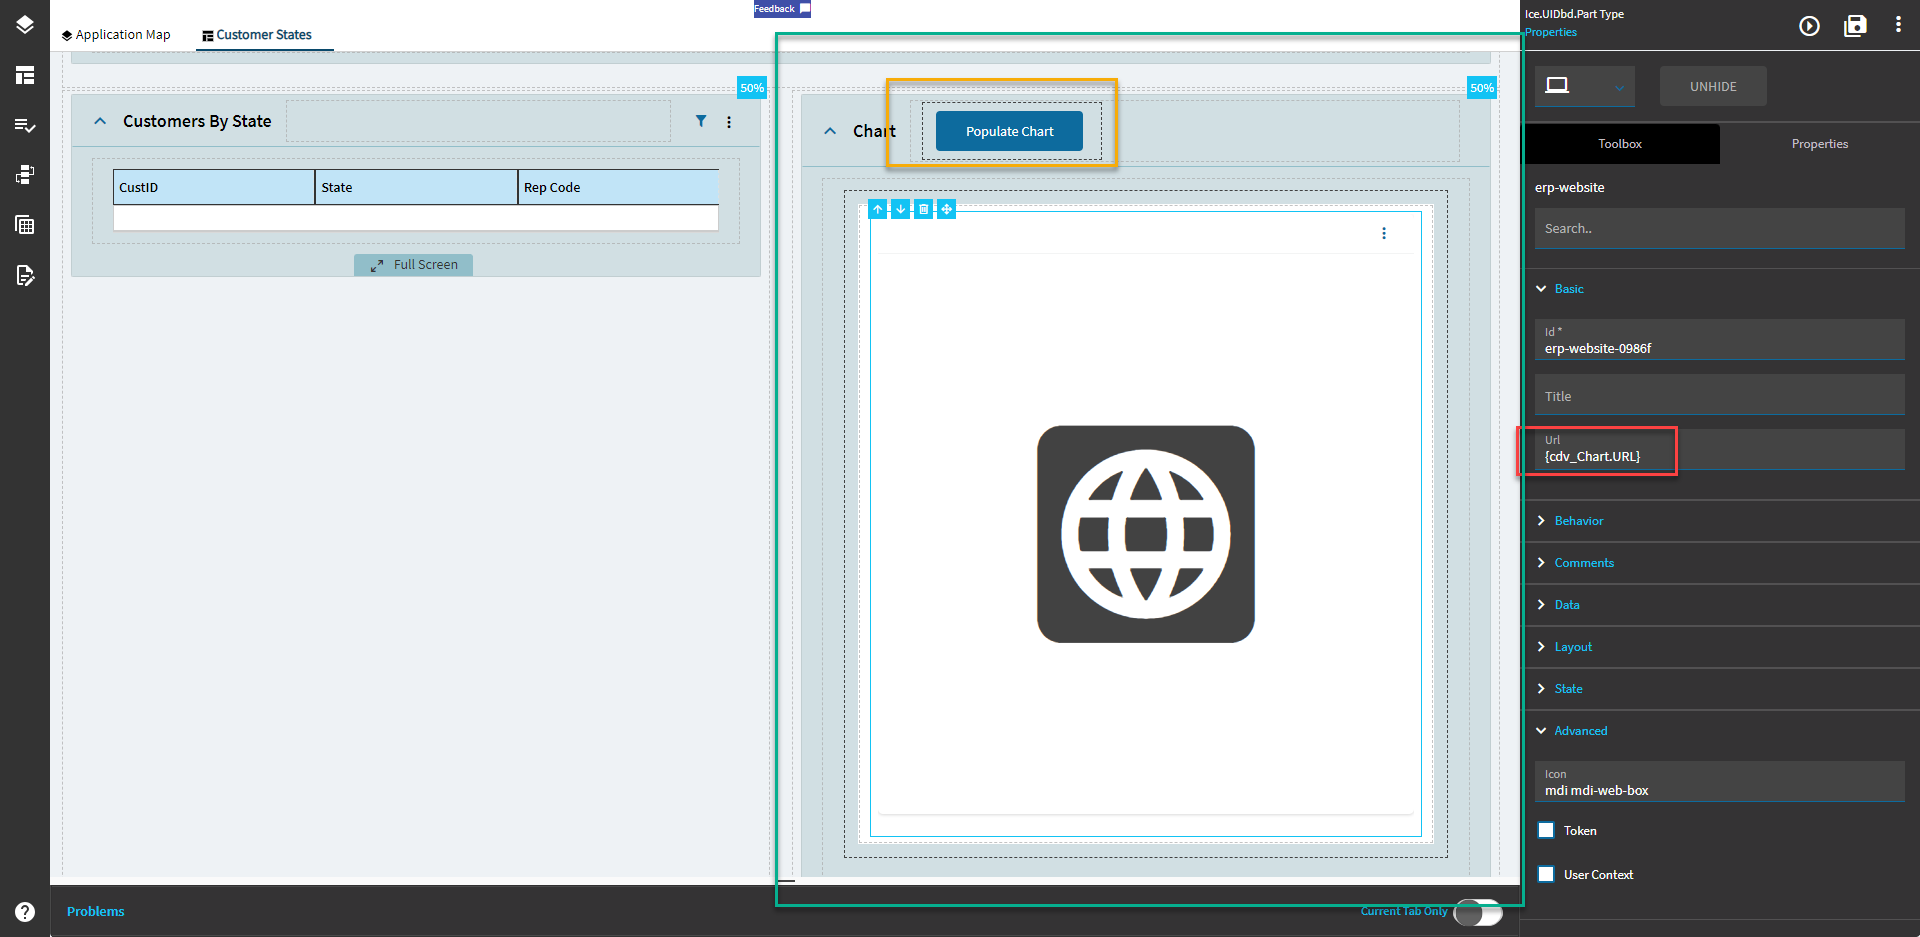
Add yourself a panel card with a column in it, then drag the Website Widget from the Widgets tab of the Tools and set the URL to the name of the dataview you created and a column called URL (or similar).
{cdv_Chart.URL}
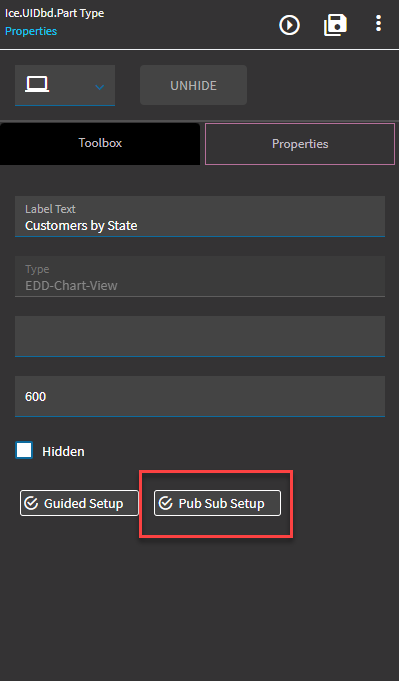
Throw a button on the form to trigger it as well.
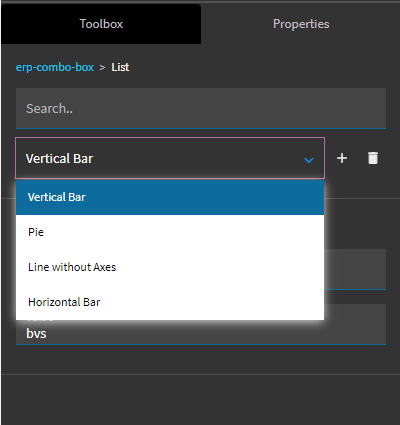
Add a combo box to hold the different chart types.
Bind it to your tracker dataview cdv_Tracker.ChartType
Set the Text Field to display and the Value Field to value.
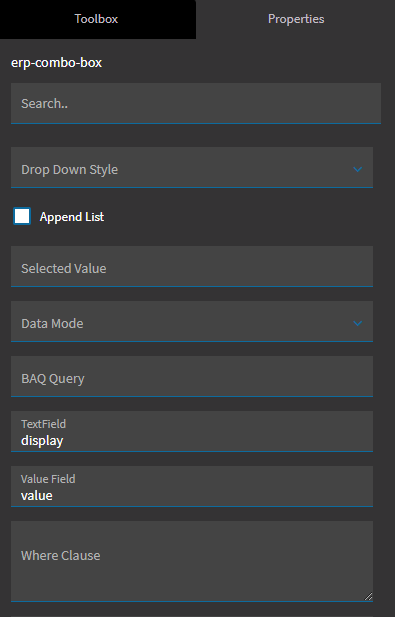
Combo > List
Add the following:
| Display | Value |
|---|---|
| Vertical Bar | bvs |
| Pie | p |
| Line | ls |
| Horizontal Bar | bhs |
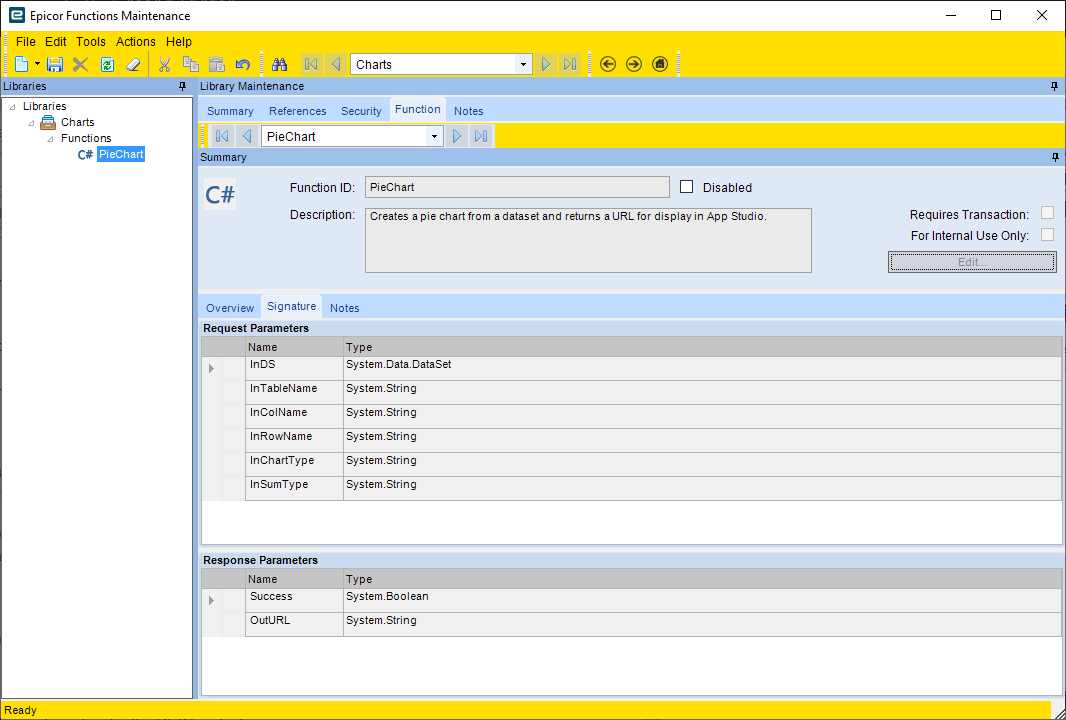
Next, create the Function:
/*
Author: Hannah Willett
Date: 06/29/2023

Documentation located here:
https://editor.image-charts.com/?tab_editor=url&tab_viewer=documentation#https:/image-charts.com/chart

There are numerous other parameters you can add to the URL string to do various things.
*/

const string BASEURL = @"https://image-charts.com/chart";
this.OutURL = BASEURL;

List<string> rowVals = new List<string>();
List<string> colVals = new List<string>();

foreach(DataRow r in InDS.Tables[this.InTableName].Rows)
{
  colVals.Add(r[this.InColName].ToString());
}

// Get the unique headers from the InColName
var headers = colVals.Distinct();

IDictionary<string, int> values = new Dictionary<string, int>();

// Add those headers to a dictionary with a value of zero for each
foreach(var header in headers)
{
  values.Add(header,0);
}

// Aggregates the data row
foreach(DataRow r in InDS.Tables[this.InTableName].Rows)
{
  if( this.InSumType.Equals("Count") )
    values[r[this.InColName].ToString()]++;
  else if( this.InSumType.Equals("Sum") )
    values[r[this.InColName].ToString()] += Convert.ToInt32(r[this.InRowName.ToString()]);
}


List<string> dataList = new List<string>();
foreach(KeyValuePair<string, int> kvp in values)
{
  dataList.Add(kvp.Value.ToString());
}

// Data
this.OutURL += "?chd=a:";
this.OutURL += string.Join(",", dataList);

// Axis Labels
this.OutURL += "&chxl=0:|";
this.OutURL += string.Join("|", headers);

// chdlp = legend location
// chs = chart size
// cht = chart type
this.OutURL += string.Format("&chdlp=b&chs=800x500&cht={0}",this.InChartType);

//  chxt = display values on axis line or change which axes are shown
this.OutURL += "&chxt=";
if( this.InChartType.Equals("bhs") )
  this.OutURL += "y,x";
else
  this.OutURL += "x,y";

// Legend Labels
this.OutURL += "&chdl=";
if( this.InChartType.Equals("p") )
  this.OutURL += string.Join("|", headers);
else
  this.OutURL += this.InColName;
Add a button click event to the button you just added; we’re going to configure that next.
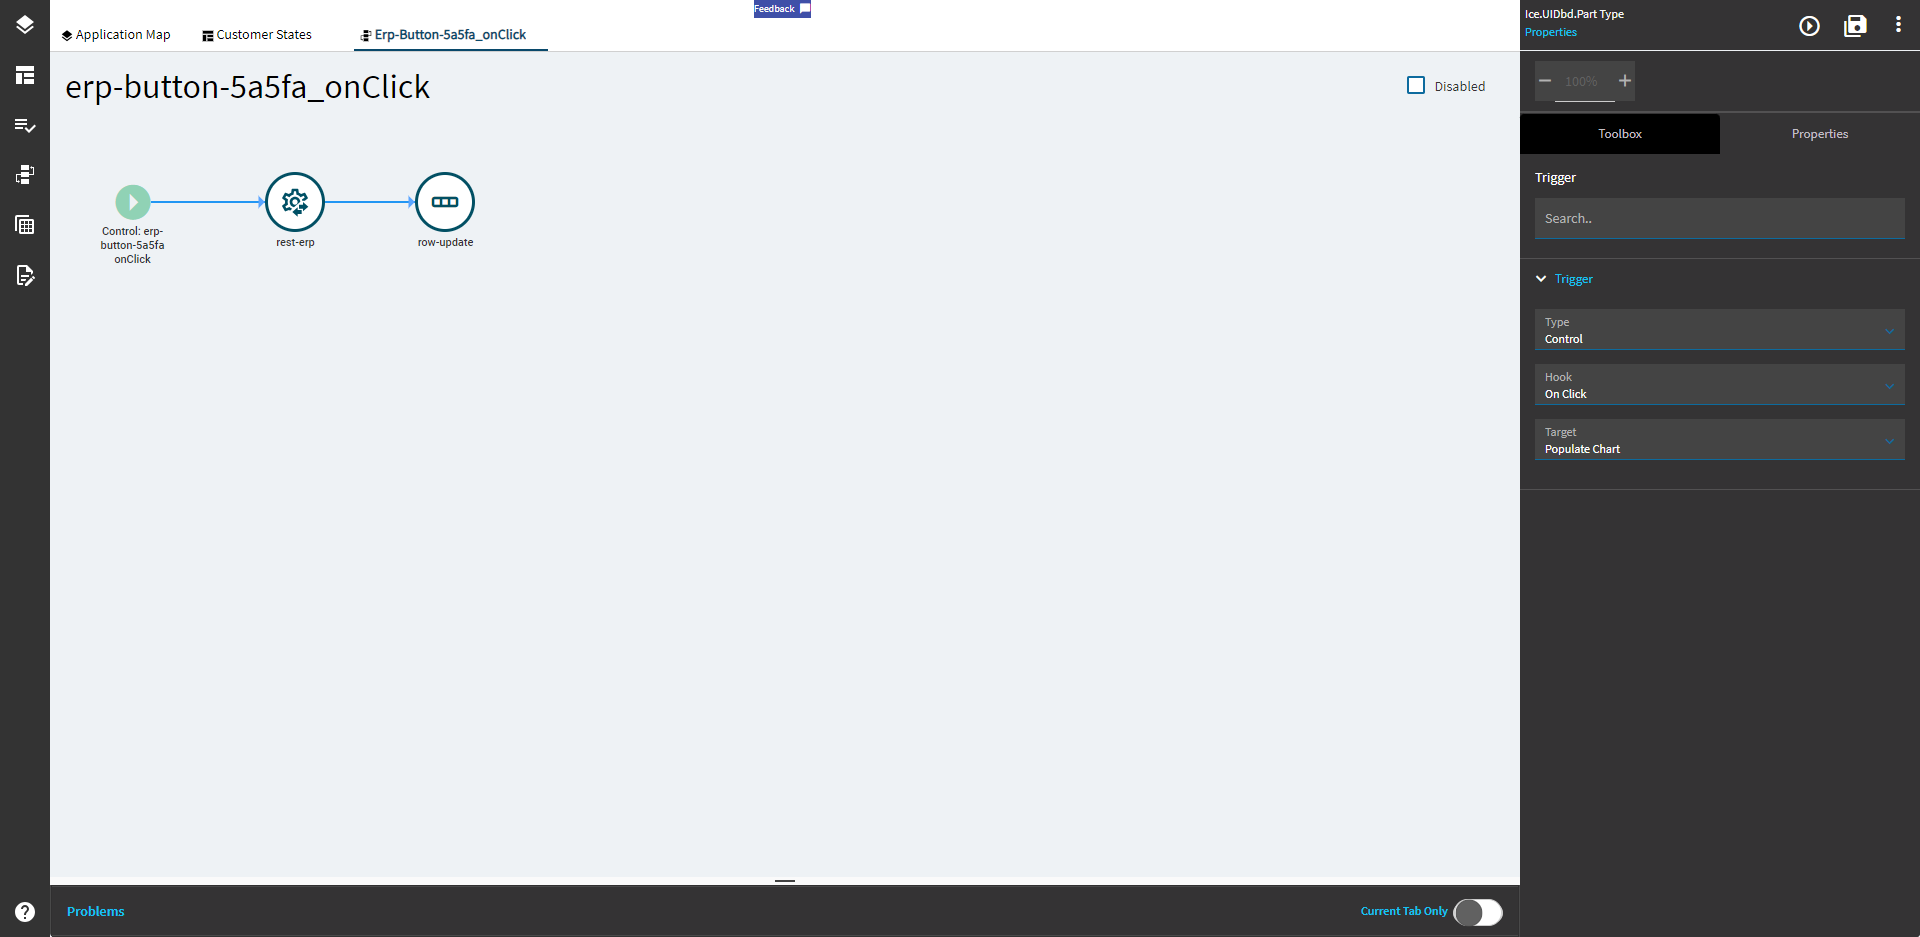
Here’s the configuration for the REST widget:
Service Name: Empty! Don’t need it.
Service Operation: PieChart (this is the name of your function)
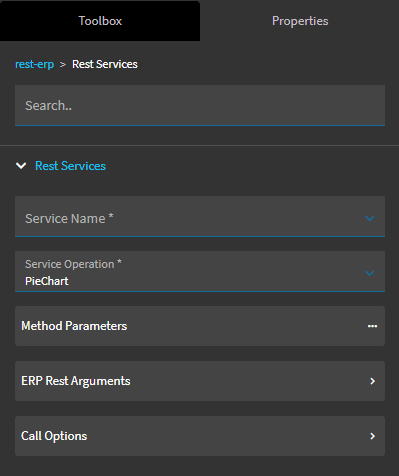
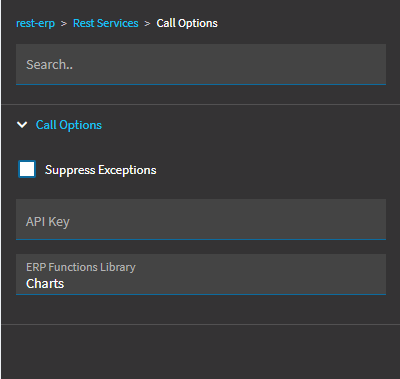
Call Options
API Key Empty–not needed since it’s internal.
ERP Functions Library Chart (this is the library name)
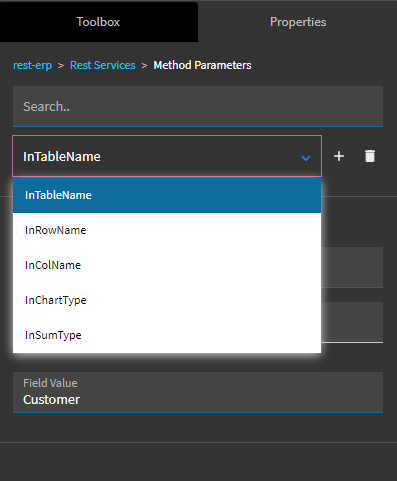
Method Parameters
InTableName Customer–this can be whatever. It’s just the name you’re giving to the table in the DS
InRowName Customer_CustID–this is the column name from your BAQ that you want to aggregate–count in this instance
InColName Customer_State–this is the column name from your BAQ that you want to graph by
InChartType {cdv_Tracker.ChartType}–this is bound to the list box we made holding the different chart types
InSumType Count–this will use count as the aggregate. The other option is Sum right now.
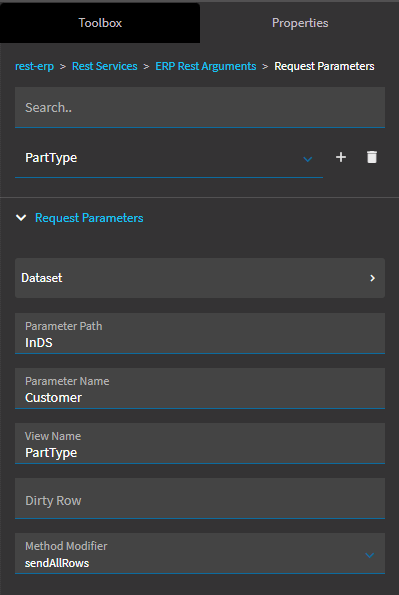
ERP Rest Args > Request Params
Parameter Path InDS–this is the name of the dataset input param from your function
Parameter Name Customer–this is the same as the InTableName value
View Name PartType–name of the view holding the data in Kinetic. Mine is technically customer-based, but I was using this for something else and was too lazy to refactor everything, but it’s going to be whatever view your grid is bound to.
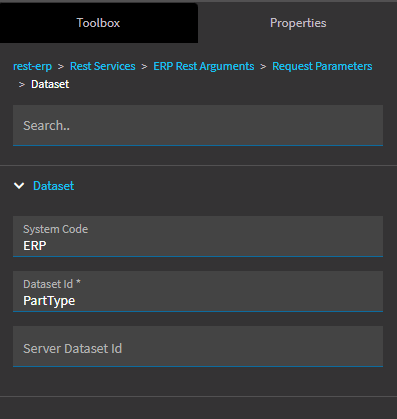
ERP Rest Args > Request Params > Dataset
Dataset Id PartType–this is the same as the View Name from above
Response Params
None
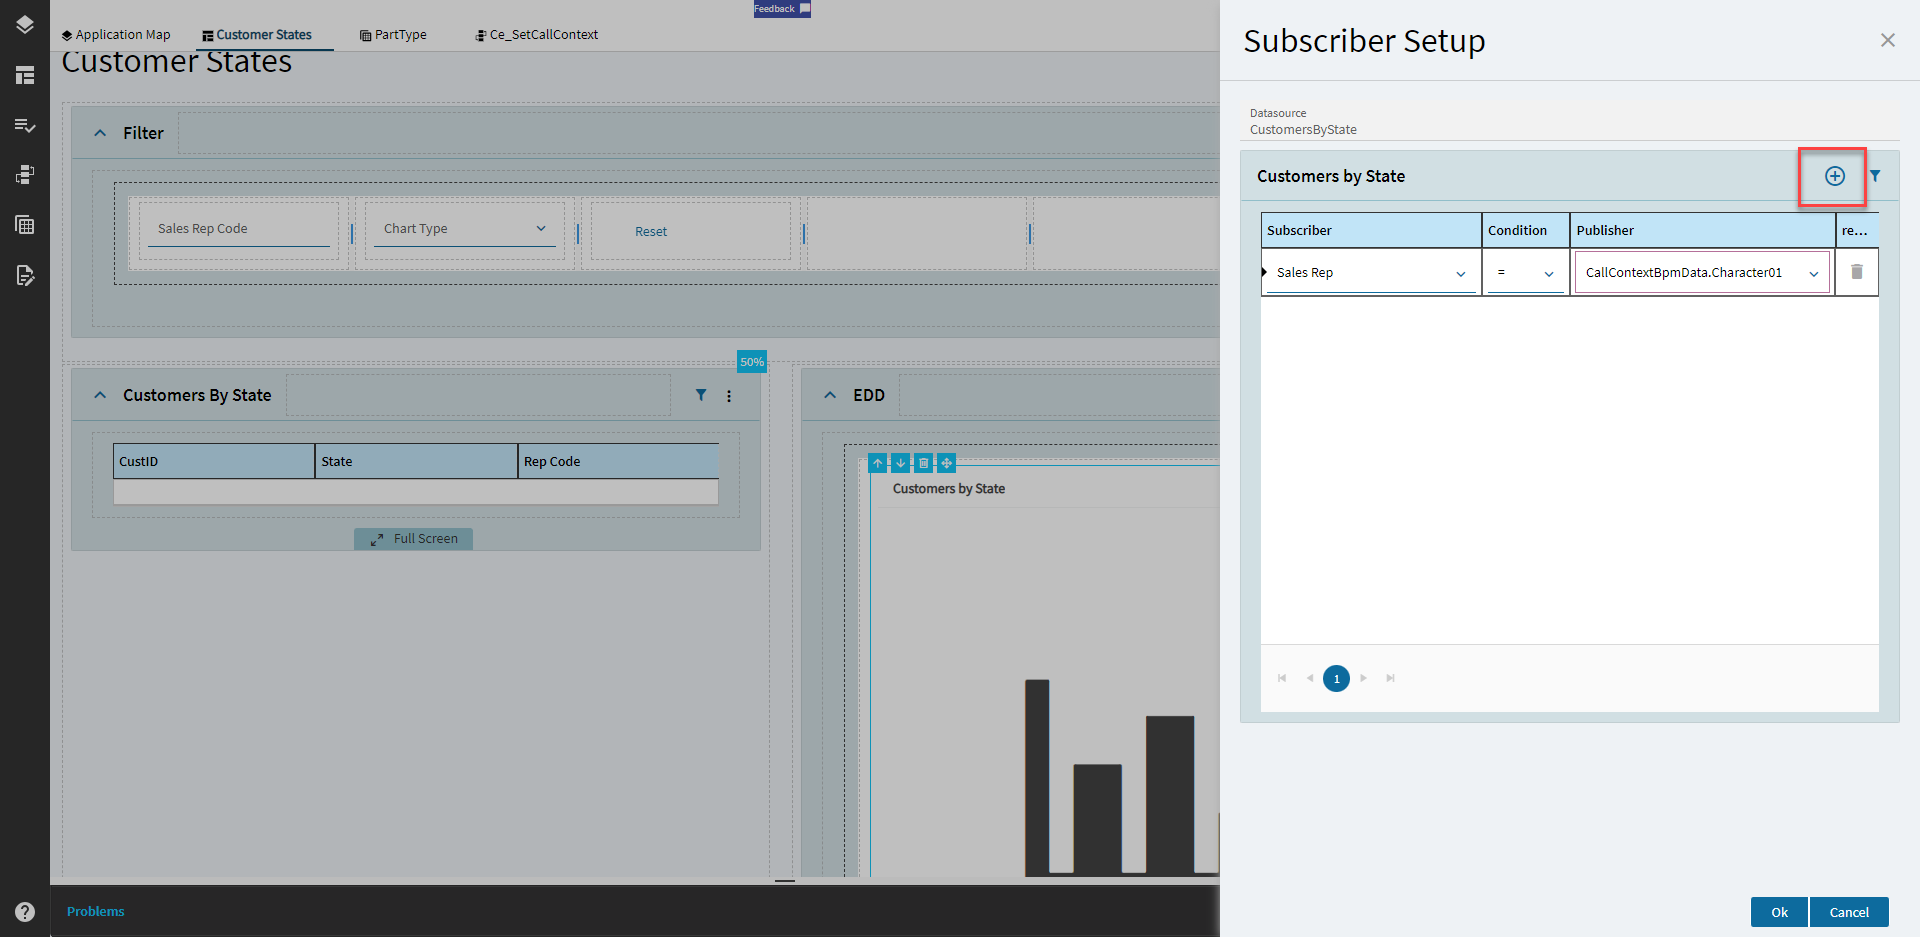
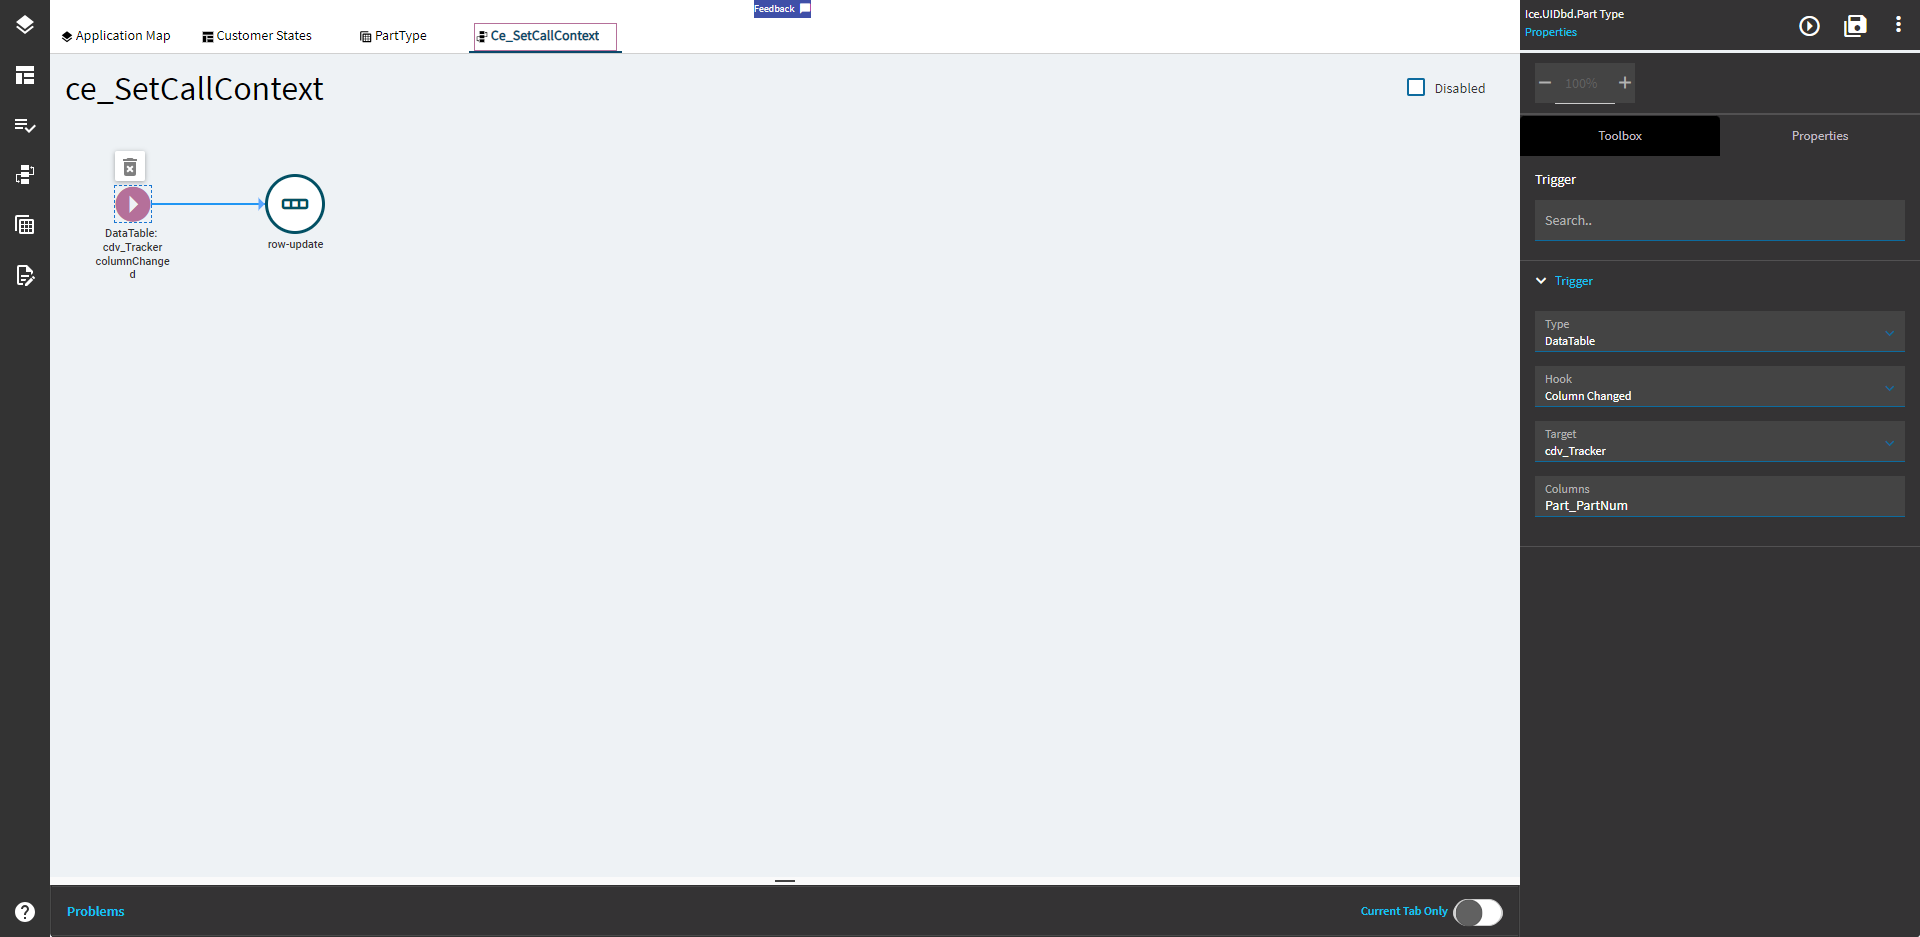
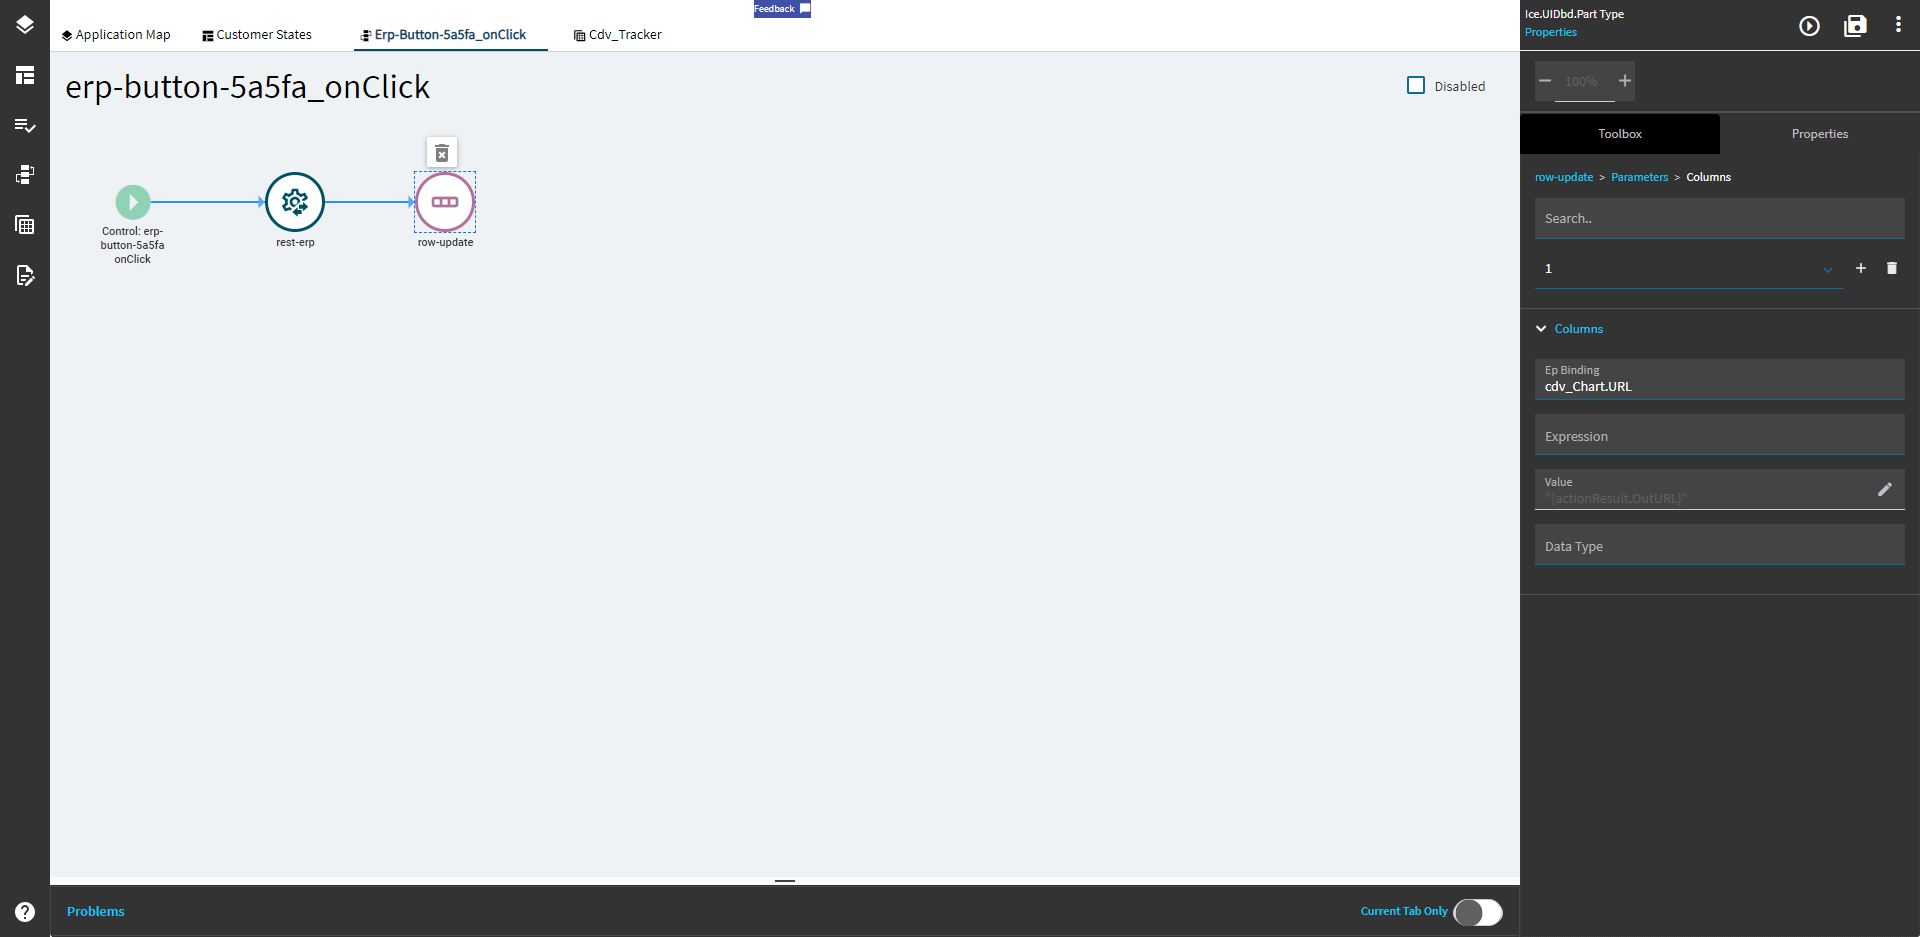
Finally, add a row-update that sets cdv_Chart.URL to "{actionResult.OutURL}"
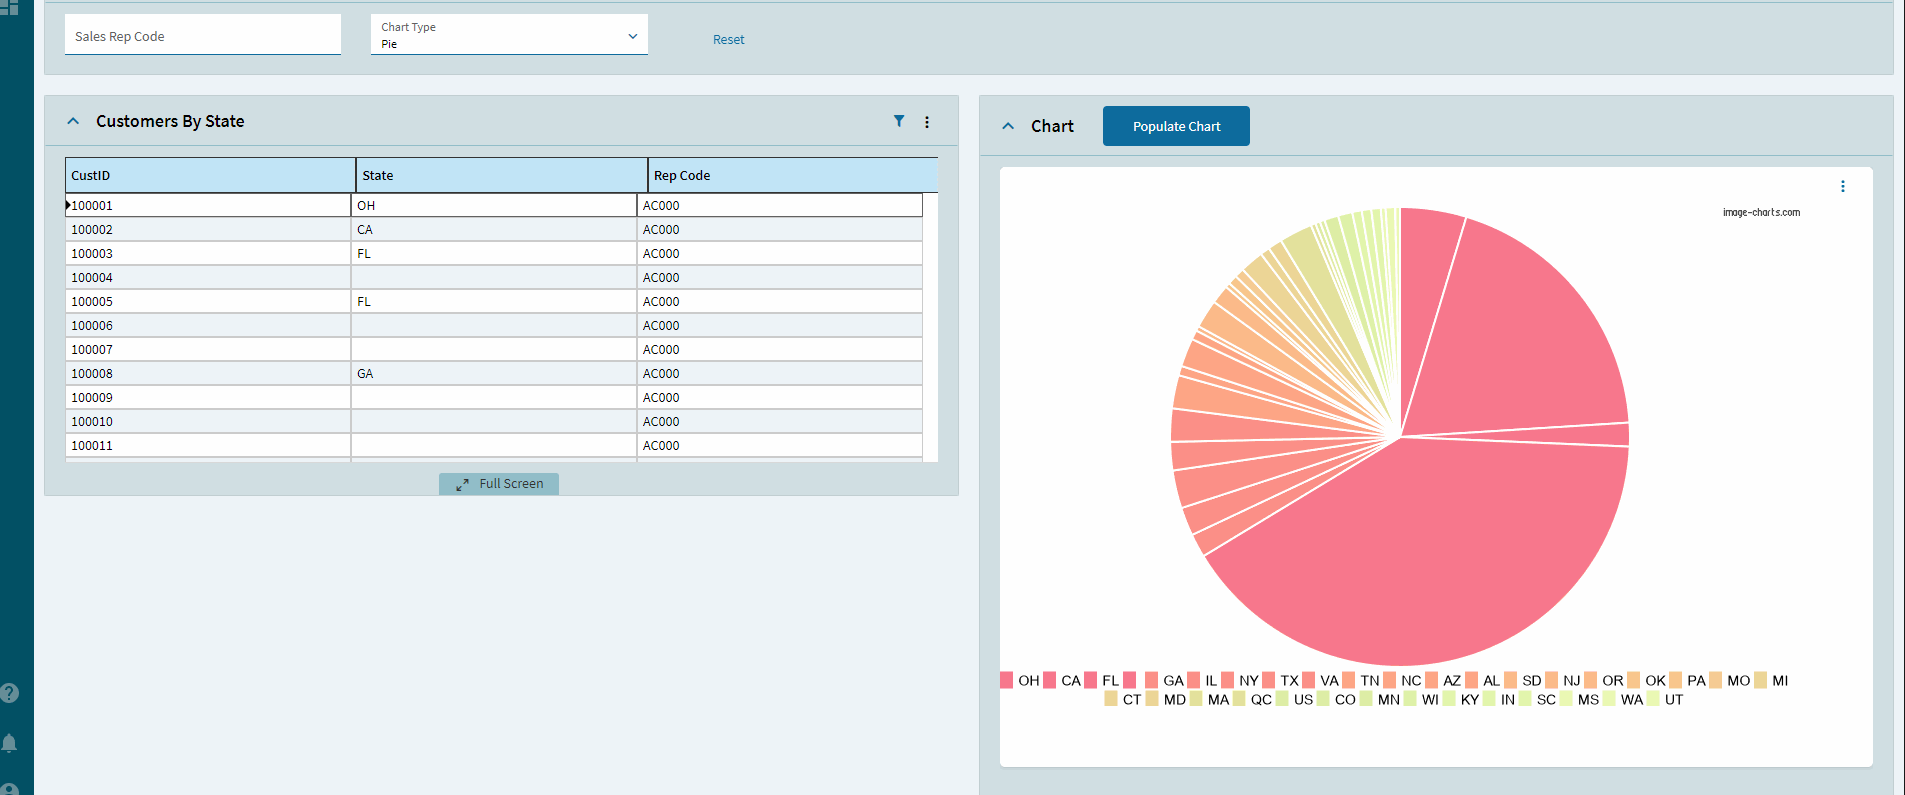
Give it a test. Assuming I didn’t forget a step, you should get some charting magic!
Solution File
DashboardCharts_Customer Solution_4.2.300.0_062923.cab (14.5 KB)
This should have the BAQ, Custom App, and Function
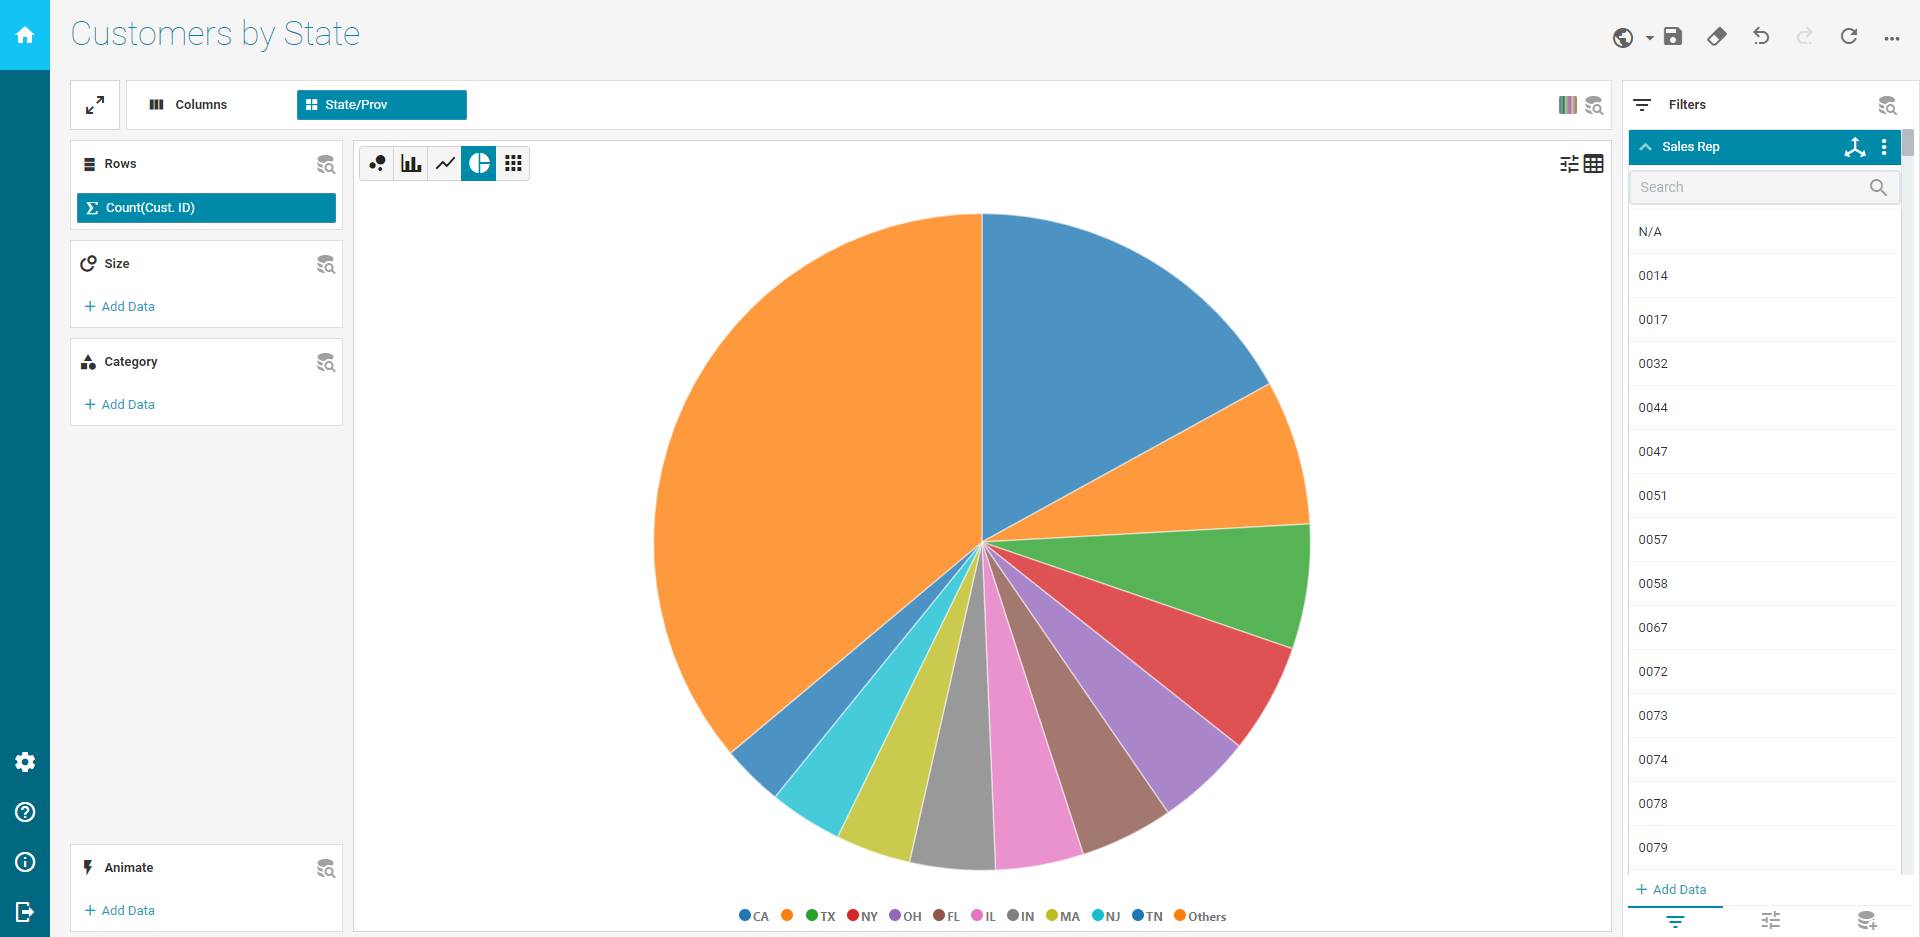
Charts made with: Image-Charts - Static image chart interactive generator