Give this a shot
This will allow you write out a trace on your code every so often and see how far the code executes.
Give this a shot
This will allow you write out a trace on your code every so often and see how far the code executes.
I don’t know if there’s a more “correct” Epicor way to deal with this, but I’ve taken to enclosing as much custom code as I can in try-catch blocks and using a string variable to track specific execution points. You can then show a message in the catch block that reveals the value of the variable at the error point, which can not only tell you where it occurred but also the value of anything that you think might be relevant at that point too.
I notice @josecgomez’s comment on trace logging, which I must say is really useful on an ongoing basis when something is running and you want to pick up errors without disrupting users. I just like the immediacy of the message when I’m still trying to get something working.
The nice thing about trace logging is that you can turn it on and off and you don’t have to remove it from the code. But yes both work just as well.
I should edit my comment, because I didn’t pick up that it was traces in the Epicor sense. That thread is really useful in its own right and I take back the bit about restricting it to only when users are involved.
This looks really helpful. I tried to add your bit of code to the top of my first custom code element. But it doesn’t like the syntax.
Can you help me design my trace syntax?
Epicor.Hosting.Trace.ServerLog.WriteTraceMessage(
“trace://ice/mytrace”,
“TraceCategoryLabel”,
() => “Some Text”
);
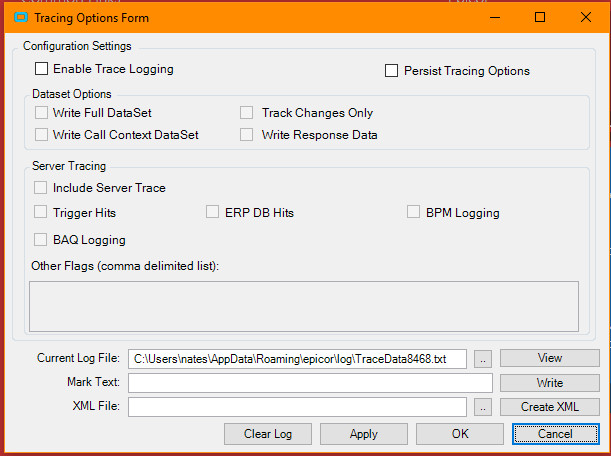
Once I have the syntax, I access it through my usual tracelog, right? Can you tell me which options to turn on?
Try using an action
Action<string> WT = (msg) =>
    {
        Epicor.Hosting.Trace.ServerLog.WriteTraceMessage(
        "trace://ice/brandon/isspecial",
        "BrandonsSpecialBAQTrace",
        () => msg
        );
    }
};
Stick this at the very top of your code.
Then anywhere you want a trace just call
WT("My Awesome Message");
and yes @Banderson is special… it says so right up there LoL
Obviously rename your trace to something a bit less “Brandon” nobody wants Brandon all over their trace 
Now remember this is a Server Side Trace (cause it runs on a BPM)
So follow the instructions on the other post to Enable it.
BPM009 Member declaration is not allowed inside code block
Clearly I am doing something wrong here…
Needs to be at the very top of your code before any other code.
I put it at the top of my very first custom code block “Pull In Data” inside my BPM. Is there another place to put it “before” this?
no that should work… what version of Epicor?
Is it possible I do not have access to appserver.config?
I looked in the event viewer and Epicor App Server is not listed.
Sorry for all the questions. Thanks for your patience! 
That’s in website directory where epicor is deployed to. Typically
C:\InetPub\Epicor…?
I am in 10.2.400.4 working in Pilot. I believe we have a dedicated cloud tenancy.
You cannot change the appserver.config.
As far as tracing goes, you might be able to get the tracing from the Server File Download program. Select the Company folder and browse the files under your username or the manager. You might find your traces there. I got fiscal year-end going on now otherwise I would be able to check it out for you.
Mark W.
Thanks Mark! I understand and appreciate your time.
What is the Server Download Program? Where is the company folder?
The source of my error was in one of my field setting elements. Instead of referencing the internal variable I created, I was referencing the query results. Obviously this contained more than one record, so the untraceable error. Thanks for trying to help me get better at error tracing. I am still interested in getting at the server traces if there is any way I can.
Thanks!!!

