There have been numerous discussions on this in the past but no solid specifics.
I’m creating some Analytics and want to include inventory turnover. The ‘book’ definition is CGS/Average Inventory.
I can calculate Average Inventory. However, CGS is Cost of Goods Sold. If most epicor users were distributors this would be easy. However, there are many component parts in inventory that aren’t sold and are consumed in other products and not necessarily on a 1 to 1 basis.
So if you wanted to know an average of how many times epicor parts turned over, whether they were components or finished goods, what would be the right way to calculate that and can you get what you need soley out of the partTran table? I need to be able to do this down to the part level so doing this via a financial statement isn’t viable.
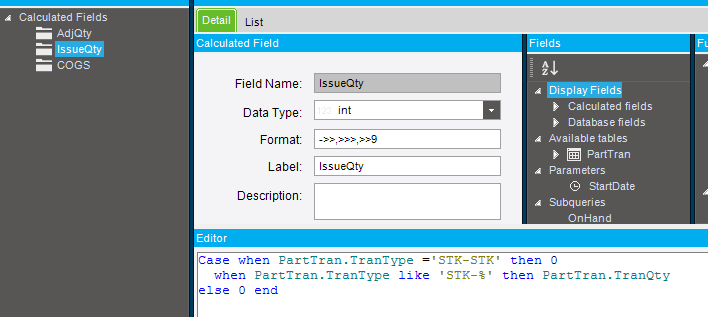
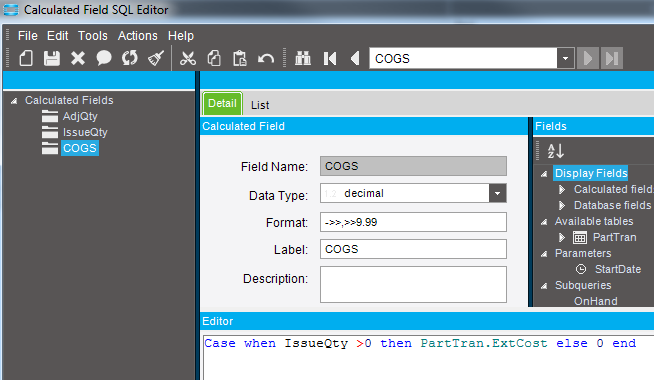
I struggled with this issue as well. I ended up summing the costs off of the PartTran table whenever things are issued from stock and treating issuing subcomponents the same as shipping product to the customer. No guarantee this would pass any accountant’s scrutiny.
Note this is a subquery and the COGS field gets summed over the timeperiod in the top level query. I also ignored a bunch of inventory transactions (DMR, adjustment etc) that could make this slightly more accurate.
Coming from a scientific background, the metric “inventory turnover” has always bothered me.
There are too many scenarios that can make the formula blow up.
A common formula for it is:
Sales (or Cost of Sales) / Average Inventory
And I’ve seen some suggest that you calculate the Avg Inv as
Avg Inv = (Ending Inv Val - Beginning Inv Val ) / 2
If your ending Inv value is close to the beginning Inv value, then the denominator in the first equation tends towards zero. So the Inv Turns blows up (gets very large).
And if your Ending val is < the beginning Inv Val, you get a negative!
You’d really need to add all the daily Inv Values together and divide by the number of days.
@ckrusen I think you got the formula wrong. It should be (Ending inv val + Beginning inv val)/2 which fixes the problem of it blowing up or going negative. You’re right it would be better to use the Average value function from Calculus, but doing Calculus to a database is hard and that one works basically good enough unless your function curve is really asymmetrical.
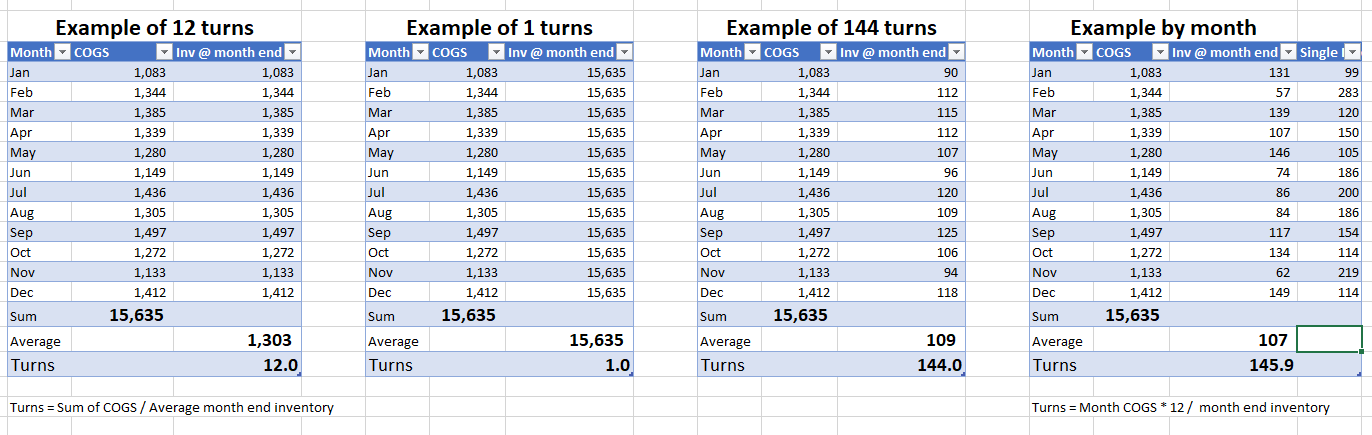
Here is the way that I have always understood Turns… it is the Number of times that you turn over inventory during a set period. So… if you always build up inventory to the same value as you sell each month, then you will have 12 turns, because you build the inventory, then sell it.
But, if at the end of each month, you always have enough inventory to sell for one year, then you only have one turn.
Below is a screenshot of attached spreadsheet that you can use to do some playing… the first three tables show various examples of 12 turns, 1 turn, and 144 turns… the 4th table shows how you can theoretically calculate turns using only one months worth of data… you can do this by taking COGS for the month, Multiplying by 12 (to extrapolate Yearly turns) and then dividing that by the month end inventory. this 4th example is fairly easy to do with a BAQ… calculating for a year would take a more more complicated, and in reality needs to have a table (executive query table?) that captures the month end inventory numbers each month, so that you could get the “average monthly value of inventory”.
So the important thing is to identify a method to use, and then stick with it.
One’s own company’s particular numbers aren’t comparable to other companies or industry standards - unless they use a very similar method. Emphasis on “very similar”.
Is Inventory turns always calculated on the inventory as a whole? Or is it acceptable to break it into groups (like part class)? Assuming this grouping is maintained, from calculation to calculation.
Yea, I’m coming to the conclusion this isn’t as scientific a KPI as many others for all the reasons above. Most ‘book’ definitions assuming numbers coming from a GL which doesn’t work when you want to look at this at a product group or item level. I looked at how another (distribution centric) ERP system does this and they calculate it as Quantity Sold (less returns and scraps)/Average inventory balance.
So if I sold 1200 during a year and the average balance was 120, that would be 10 turns.
Seems a reasonable interpretation to me.
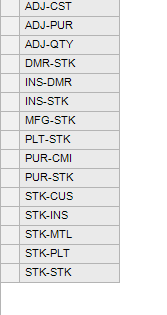
Of course the PITA part is I have to go in and surgically pick out from the dozens of transaction types the ones I want to count. For example, Sending stuff to DMR I’m ignoring because it’s either going to come back ok, or get scrapped. To me turns represents ‘good stuff’ like sales, so if I have scrap problems that will show elsewhere but personally I don’t think it should boost my turns.
I agree Mark, but there are not so many transaction types if you limit it to inventory transactions only. I count 15 in my database, most of which are pretty straightforward.
I can see how Distribution companies would/could have a different measurement than manufacturing companies… But, I know of multiple manufacturing companies where they have a small number of finished goods parts that actually ship (fixed asset companies) but MANY raw materials that make up their inventory. if you ignore total inventory of raw materials, and look only at the finished goods, their turns would be incredibly high (good) becuase nothing is ever in stock. Also, in an MTO world, you have to be careful because inventory “Should” include WIP value. (which is typically hidden in a pure Inventory report.)
I once had a customer who bragged about their inventory turns of 220 (basically daily turns), but then I saw their Inventory of purchased motors. They manufactured Pool Pumps… OH… did I mention that the “Inventory” was supplier managed? So… their “Inventory” was not really ever inventory. They “purchased” it at point of use in WIP, and immediately shipped the finished goods… so (in my view) their “turns” was phony.
What is the transaction type used for sales order Purchased Direct type orders? need to make sure that those are properly skipped when calculating inventory.
That’s the perfect way to do it. You have no carrying cost and you let everyone else take the risk for your reward. That’s one of the reasons that that KPI exists is to incentivise keeping inventory low. If someone else owns it, that’s a benefit to the company.
We calculate Inventory turn for the month for each product group by project cogs for whole year by multiplying monthly actual cogs x 12.
Cost of good sold / Average Inventory.
Since Cost of Good sold is based on a period of time (ex. 1 month) and Inventory is a point in time (ex. as of 04/30/2019 (entire value of inventory at a point in time). We multiply the cost of good sold number by 12 to make it estimated yearly figure.
(Cost of sales for month x 12 months) / Average Inventory.
Average Inventory is averaged through out each month.
Average Inventory = Ending inventory of (Jan’19 + Feb’19 + Mar’19 + Apr’19 + May’19) / 5 months
I saw in one of the 10.2 releases there is going to be a monthly inventory snapshot in EDA, looking forward to seeing that.
Back in the CoreVu days (been so long I can’t remember how it’s spelled) they had some inventory reporting. We were able to tie to it and verify the transaction types. You had to be careful though, there was another flag we had to check (maybe stock transaction?). They have added other transaction types since then. It’s important to test the various transaction types and make sure you are getting all those that pertain to your company. Validating the reporting data is crucial to provided accurate information
 )
)