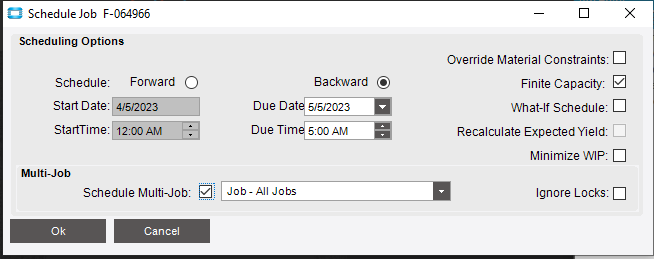
When in Job Entry using the dropdown Actions, Schedule, Job Scheduling, what used to take seconds is now taking minutes to run. Image to show exactly where I am talking about:
If I click Schedule Multi-Job off, it runs quickly like it used to. I went and checked both Test and Pilot (our Pilot has been overwritten with a different version of our live database so I have in effect two Test servers) to make sure that this being checked isn’t something new. It’s not.
I didn’t make any changes to any logic around scheduling or anything that I believe would affect this and I know the slowdown started today (our engineers use this feature every day and they are quick to complain, errr, let me know when things don’t work).
Also, this slowdown is occurring even with jobs without subassemblies - but turning off multi-job speeds them up as well (even though my understanding would be that these jobs do not have multi-jobs). Any ideas or suggestions as to which direction to go. I already restarted both the task agent and the application pool.
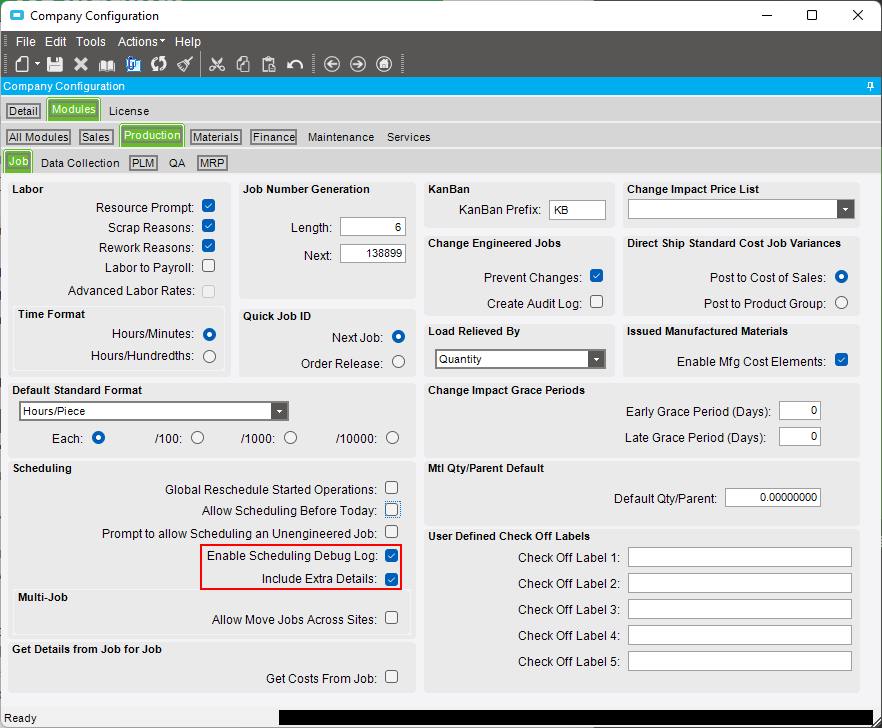
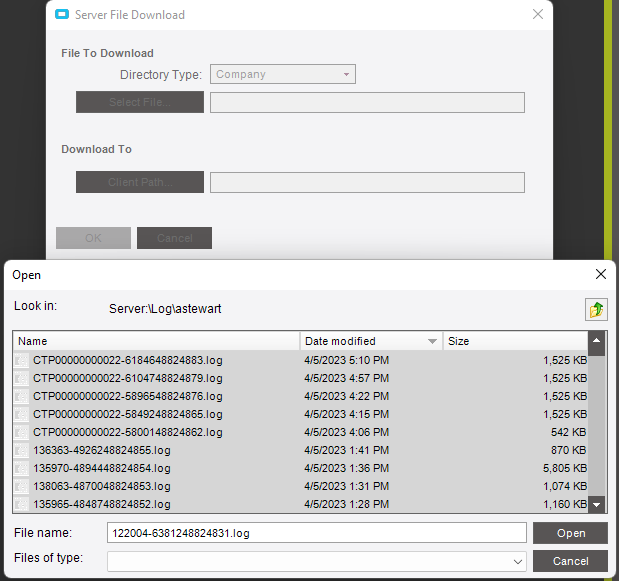
I checked these and ran job scheduling from job entry and it doesn’t create a log in the same place as global scheduling. Is it supposed to be in that location or a different one? Looked through all the options in server file download and couldn’t find it.
is the job you are scheduling part of a large multi-job setup? the more jobs that are connected, the longer it will take.
Did someone change the Finite capacity or flags on any resources?
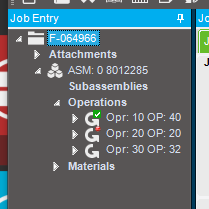
The job couldn’t be any simpler and is not part of a multi-job:
The finite capacity and flags on resources haven’t been changed recently (I check these almost religiously as I’ve been trying to get scheduling to actually work correctly for almost two years now). The only thing that was changed recently was the Finite Cutoff on Site was changed from 90 to 365, but that was 10 days ago and the issue didn’t start until yesterday.
They were actualy there. I ordered them by the date modified but forgot that Epicor does that alphabetically rather than actual time and so it was buried within other ones whereas I was expecting it to be at the top when I sorted by date decreasing. Now to dig through it and see if I can find a reason.
More confused after looking at the log. I clicked the button to schedule the job at 1:32 pm . The window closed at 1:37 pm. When I pulled the log, scheduling ran for 6 seconds from 1:32:52 to 1:32:58 with no issues. So now my question becomes, if it’s done scheduling, why does it wait 5 minutes to close the window.