One of our sister companies uses a platform called Lojic (lojic.us) for creating dashboards that are displayed on 15 different TVs scattered across their shop. We started to look into using them as well, however they (the people at Lojic) have not responded to a single e-mail in over a month. To me, that is bad business.
Because Lojic seems to have better things to do than work with potential new customers, I figured I would start looking elsewhere. Do any of you have any recommendations of systems that you have used in the past?
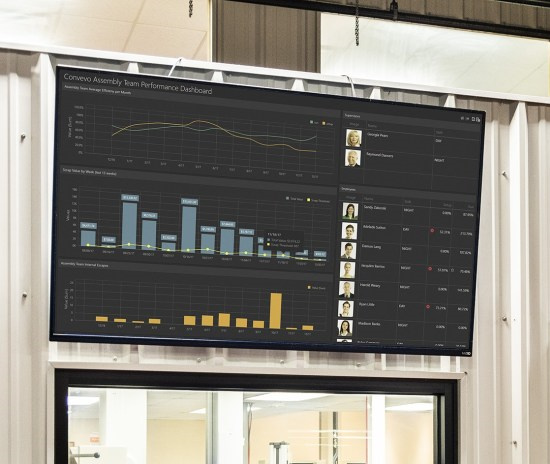
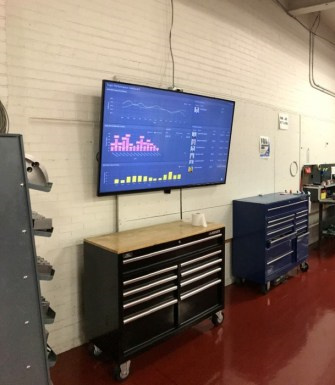
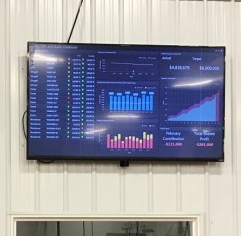
The images below are from the shop at our sister company (and are actually the ones that are used as examples on the Lojic website).
@YGT - That is where the troubles lie. I have tried to work with PowerBI and other similar tools, however without knowing exactly what DB tables I need to be looking at and linking together everything just ends up with incorrect data.
I am sure there is a way within Epicor (via BAQs, or with REST) to be able to say: “Hey, give me the data for the sales in Jan of 2019” or “What was my total rework for DATE_RANGE”, and have some raw data returned that I can manipulate and display. I am not familiar enough with Epicor to know what I should be looking for to do that though. My interactions with Epicor are minimal, usually just editing/creating customization’s that are never really complicated.
There are lots of BAQs in epicor that you can use without having to know much about the tables. If you are on the most recent version of epicor you should check out the BAQs that are packaged with active homepage because those will answer the questions you mentioned.
if REST is working in your environment, then it is very easy and straightforward to export the data to any charts/graphs app in any interval you want and display it the way you want as @YGT mentioned many BAQ’s are already built-in and you can read the educational manual if you like, it will easily put you on the basic level.
I use a combination of BAQ’s, Rest API generating JSON and Google Charts.
This then creates browser based shop floor displays that shows the operations currently been worked on, how many people are working on them and whether they are within time or over.
The whole thing is written in Javascript/ html and updates every 10 minutes.
The same approach is used in purchasing, dispatch and repairs, to display their KPI’s.
And FWIW, people like @josecgomez and even Epicor use the REST interface primarily with the BAQ service. The entire CRM Mobile App appears to run on UBAQs. This is clever to me because it abstracts out the implementation details/signature of the underlying Business Objects making it more resilient to changes. EDD is based on BAQs too. I sense an Epicor Design Pattern here…
+1 for PowerBI. It has been pretty easy to teach people so that they departments can create/modify their own dashboards as long as they have the data needed.
Although we are not yet on 10.1.500+ so we cannot use the REST apis and are using DirectQuery.
@aclements Your solution sounds pretty interesting. What made you decide to go that route instead of using something PowerBI? Wonder how much better it would be on performance.
My decision to go down this route was based a bit on my previous experience of working with JSON outputs away from Epicor.
I have used Power BI before and it is a very good product, but it didn’t seem the right tool for shop floor displays.
Performance really depends upon how you build it. For example, a fairly common requirement is drill down. My approach was to grab all the data in the first BAQ and then drill to the transaction data using the Google Chart API, thus drill down is almost instantaneous.
Cost is another consideration. The Google Charts API is free to use and very powerful.
Finally, the dashboards can all be accessed on people’s PC by just entering the same URL as the shop floor.
We do not currently have them on the shop floor and are using them around the office and for executives so the powerBI app is useful for them to access on mobile or tablets.
I do want to look into Google Charts API for an alternative method in case we decide to expand directly on the shop floor. Cost reduction is always a plus as well.
All displays have a compute stick plugged into them so accessing by a URL is not an issue.
The problem I’ve found with using BAQ’s with Rest is you need to treat each one as a separate data source. Proper Rest implementations lets you connect to REST similar to connecting to SQL Server and select multiple sources or tables to pull into your PowerBI environment.
With Epicor, you can only bring in one query per data source
Why wouldn’t you combine all of the Epicor Sources into a Single Data Source? Calling the BAQ service, does indeed allow one to pull in multiple sources or tables from Epicor. I don’t know PowerBI well enough to know if it can combine other resources with an Epicor one but I’m interested in PowerBI since several well-respected members of this list use it.
One of the biggest complaints about REST (mostly from the GraphQL folks - who demonstratively don’t understand REST) is that with REST you have to call all of these single sources. I believe this is only true because I imagine most developers are auto-generating REST services bases on their schema and not necessarily on “resources” that people actually use. The GraphQL people are correct here in a way. GraphQL builds views for you and returns everything you want but what they think REST is a protocol and it is not. Now @Bart_Elia might call me a RESTafarian here but REST is an architectural style and not a protocol. Since it replaces SOAP in some contexts, it makes sense to think of it as a protocol but it is not according to Roy Fielding - the creator of REST. (And for the record, I AM a bit of a RESTafarian…)
Whilst not as fancy you can do charts, and guages in Dashboards, and it’s in E10 already. I think you would be able to pickup the employee photo too, although I haven’t tried that.
I haven’t tried Google Data Studio, but I am very keen to keep my data sources in Epicor as BAQ’s, not native connections in SQL server.
As I understand it, the only way to get Rest API’s into Data Studio is via Google Sheets and all of sudden it starts getting quite protracted.
This wouldn’t be the case if I was building a multi dimensional analysis package. In this case something like Power BI (or maybe Google Data Studio?) would be my preference. However, for standard KPI displays and drill downs Charts works very well.
I found the Epicor BAQ -> Hub -> WebSite architecture is very easy to maintain and expand and also you can secure the connection between the BAQ and Hub, without giving the users access to Epicor
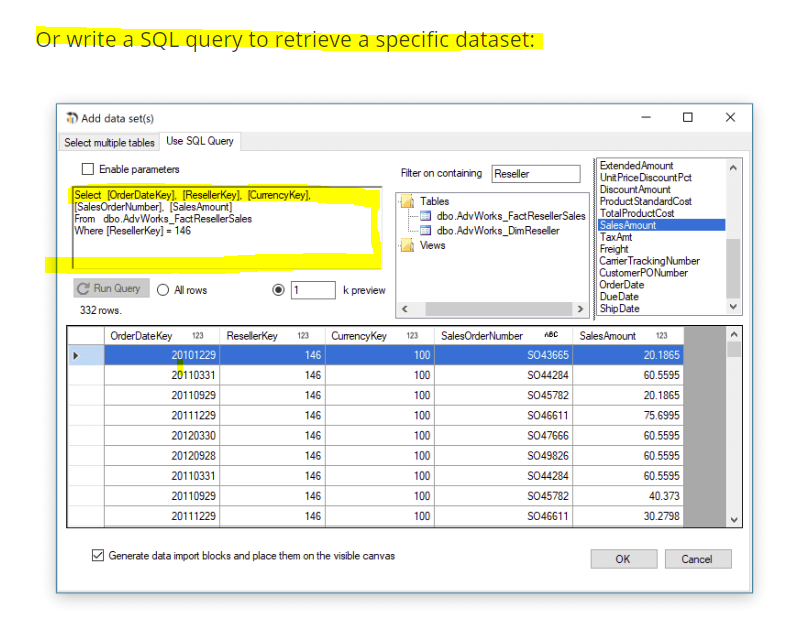
this is one of 6 methods, the method i found easy is just to copy/convert the SQL statement from BAQ designer straight to the select box, and that is it, it is the same idea for Excel, Acces, PowerBI, or any SQL based app both client or cloud, the principle is the same, once you get your configured data into the app, then you can design the display you want and what ever refresh interval you want, and as i said this is mainly used to display metrics of limited amount of live data on screens without paying any fees.