Warehouse Digital Signage

Good afternoon,
We are considering implementing several large screen dashboard-style displays at various points in the shop. To begin with, we want to get one device up and running in the managers office. This will be the proving ground. If we can get this one to work, the goal is to have up to a dozen such devices around the shop.

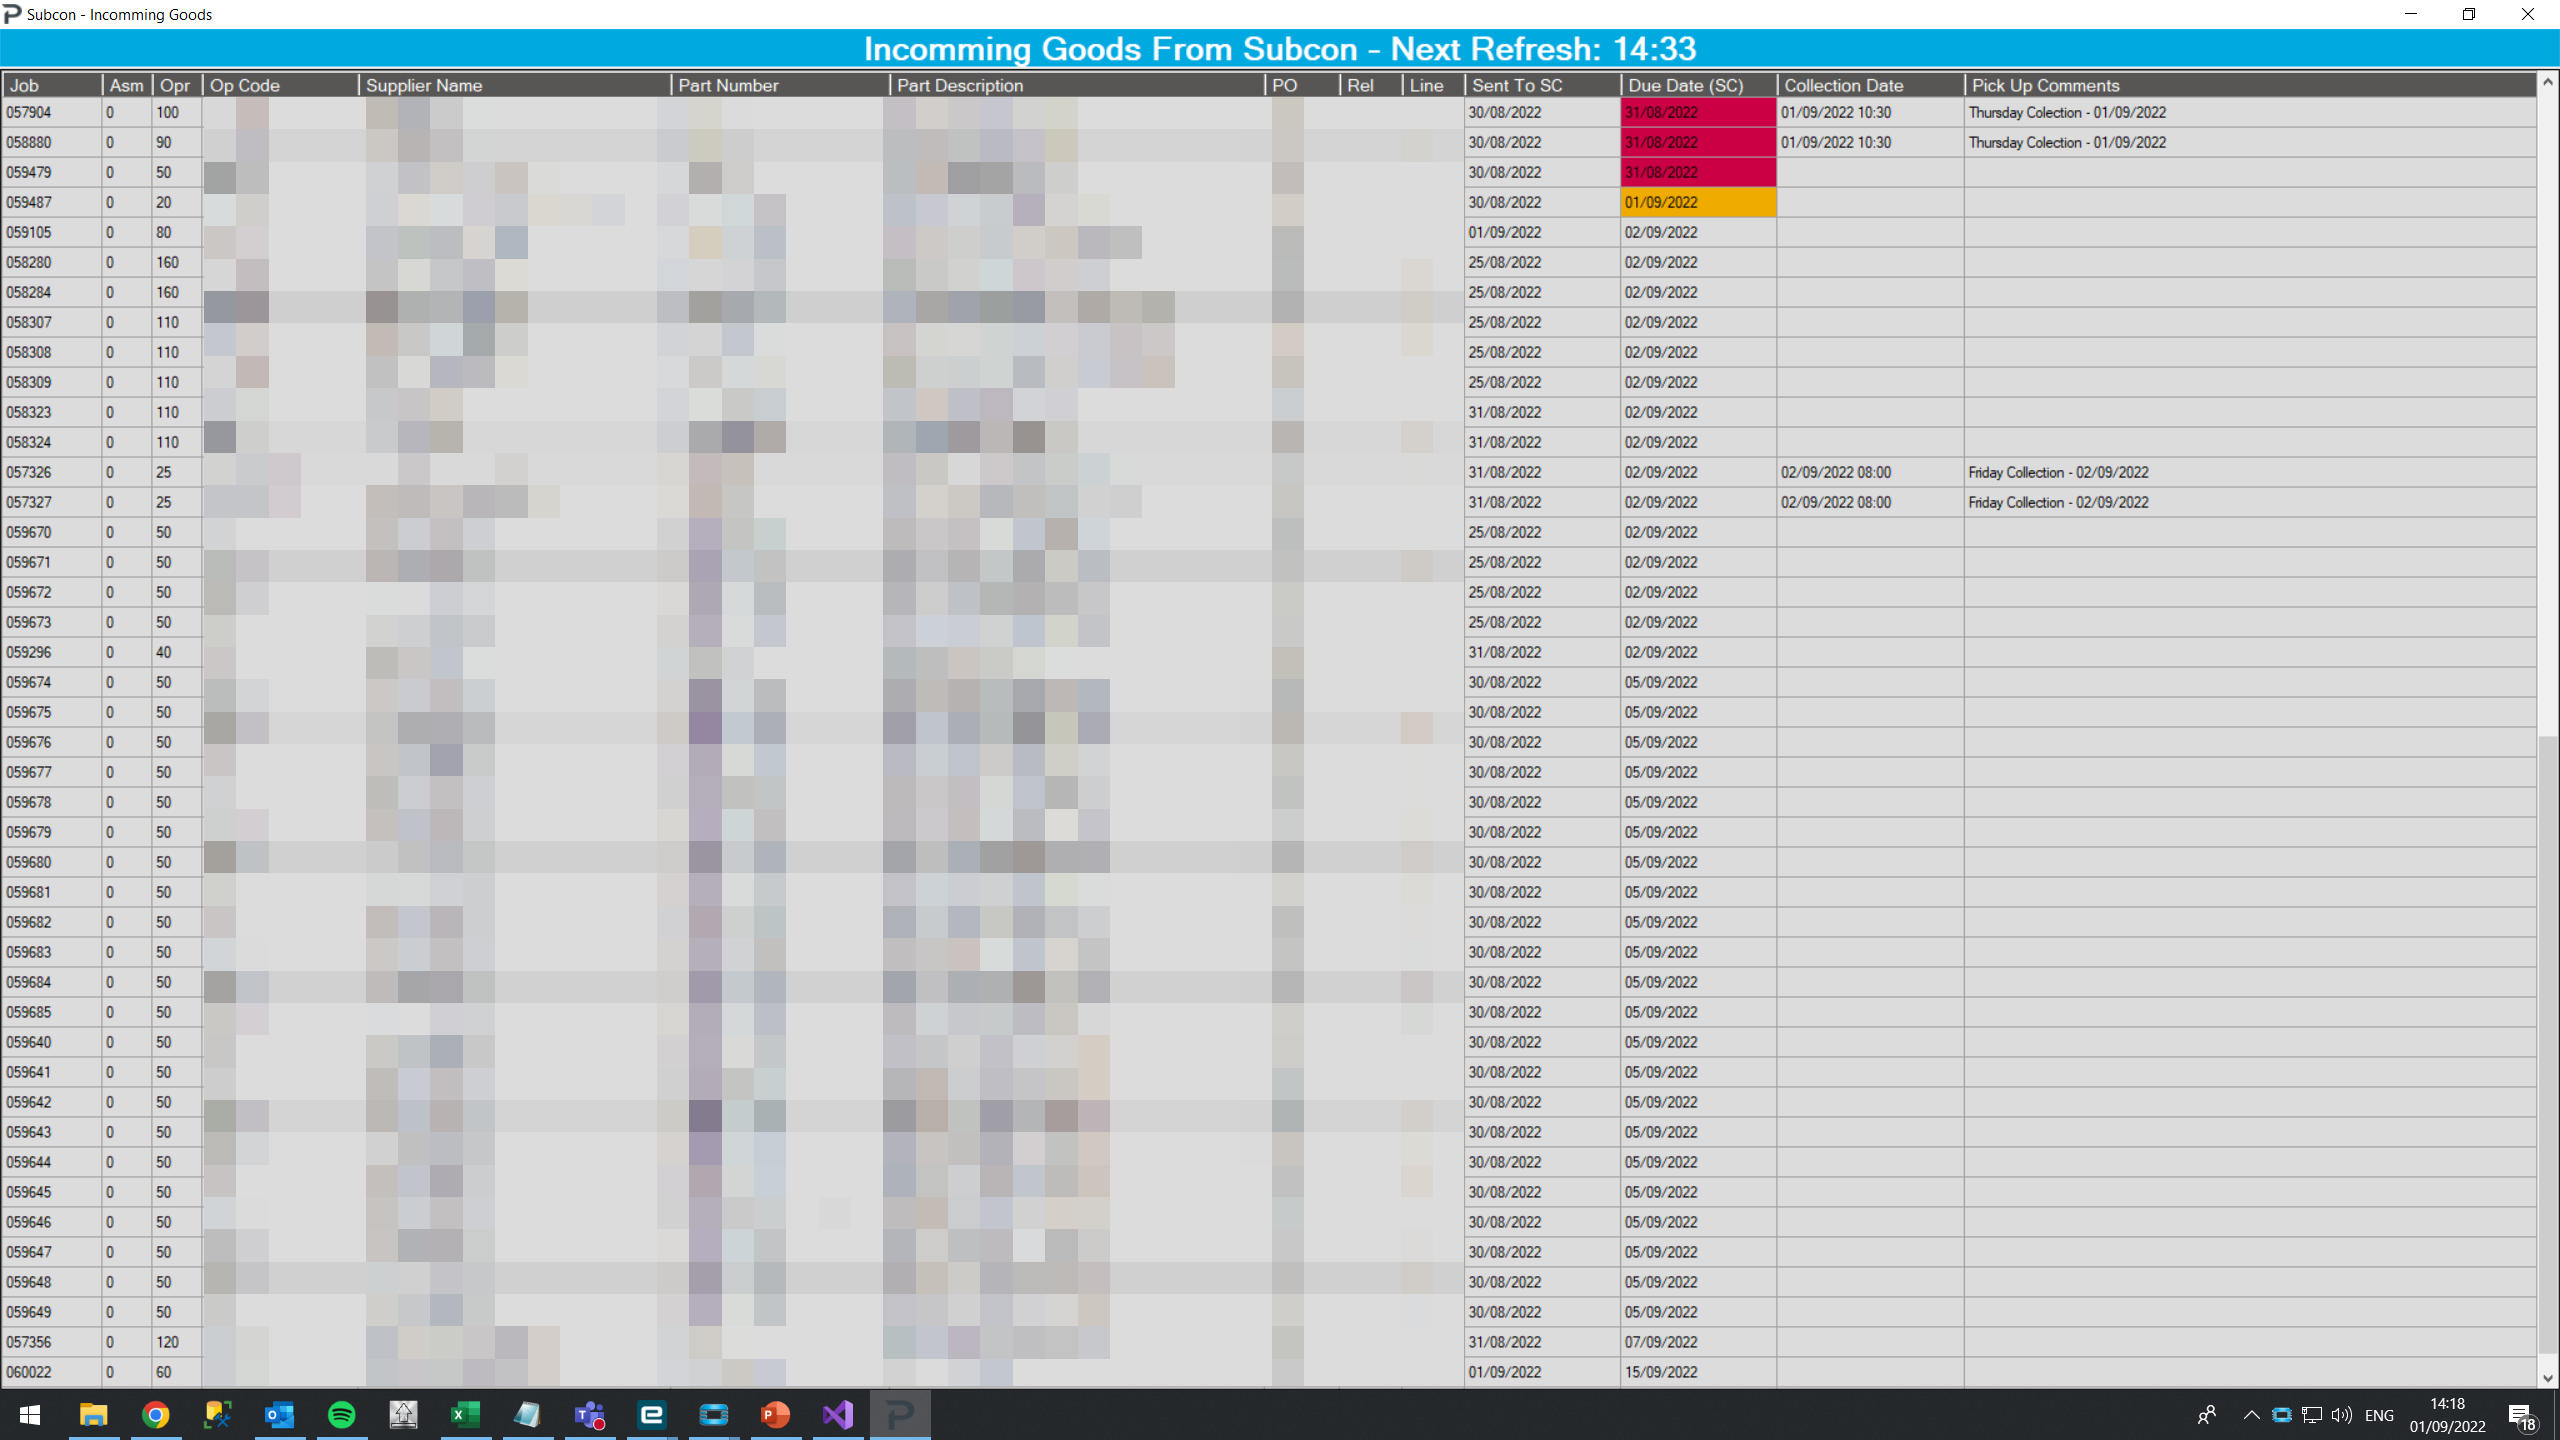
The display will show data from epicor (probably from EDD), we may also want it to show images, videos, announcements, or other non-epicor stuff.

I did a little research on here and found:

and:
Digital Signage Software Recommendations - Off Topic - Epicor User Help Forum (epiusers.help)

EDIT to ADD: KPI Software for shop floor displays - ERP 10 - Epicor User Help Forum (epiusers.help)

It sounds like there are a lot of options. We would like to avoid using epicor licenses for every display, so we are willing to have epicor data refreshed on a regular basis.

I would love to be able to manage each display remotely from my PC in the office. It would be nice if we could avoid installing a whole-hog-windows pc for each display. Many locations that would get a display already have a PC nearby for users to run Epicor. In some cases, I would like to use the existing PC and install the display as a second monitor.

Questions:
What kind of hardware do you use? I don’t think we need a 4k smart TV, but they are soooo cheap! We want at least 40" displays.

What kind of software is needed to support this kind of hardware? It would be great if something in Office 365 would do the trick. I always hate pulling in third-party software. But I am willing to look at some if it is worth it. Are third-party solutions secure? Google and Grafana are great free tools, but what makes them free? What are they gaining from my data?

What are some gotchyas that you found when setting up your warehouse displays?

Thank you all for your time and consideration!
Nate

Xibo and Grafana work great together for this. You have to do a cost analysis on the TVs though if these are going to be on A LOT it may be worth going commercial grade or you’re replacing them every couple years. Make sure it’s at least 1080p and has high contrast ratio. I recommend LGs or Hisense

2 Likes

If I understand this correctly, Grafana will collate the data and generate some nice looking charts, while Xibo will take this data and display it on the screen. Is that right?

It looks like Xibo is open source, but it also has a subscription. Do you pay for it? Being open source, I think I could set this up completely on our servers to avoid that subscription fee, right?

What “solution” do you use in Grafana for Epicor? Is it through MySQL?

Check Microsoft Power BI. Easy access to Epicor data. If you are looking for real time stuff you can refresh as often as every second VIA DirectQuery. The ability to design and publish dashboards and put them on a server for viewing/display.

1 Like

This looks like a great solution too! Do you pay for just one user that manages all displays, or do I need a user for each display?

They have a few different license types but basically anyone who will be developing/creating dashboards will need some kind of paid license. Viewing dashboards can usually be done with a free license, depending on exactly what you need.

1 Like

Hi Nate,

I’ll Add another option to the mix, have you thought of doing it in Visual Studio ?

We have done a few and even styled them to be consistent with the Epicor styling.

Here is an example we have done for Incoming goods from Subcontractors.

2 Likes

We have our own Xibo server setup, but we do pay for the android display devices, DSDevices @EarlGrei can give more in depth info on it.

Xibo makes their money from a Hosting service they run and licensing fees on a per display basis for certain types of displays (because they are more onerous to develop for I imagine).

Our Xibo server (self-hosted) works pretty much perfectly. There are some gotchas that you have to watch out for overall but it makes it VERY easy to get solid data up on screen from a large variety of data sources.

Current types of data and systems displayed:
PowerPoints
Static Images
Grafana Screens (This is generally Epicor Data via MSSQL and Custom REST Plugin)
Camera Feeds
Standalone Web Pages (Think Weather, News Feed, that kind of deal)
Calendar Feeds (From Office 365)

I’d be happy to answer questions if you’ve got any specifics.

4 Likes

Thanks Thomas! I am curious about Grafana. I have just started playing with PowerBI, and I can at least get some of my BAQs into charts. I have to learn DAX, but that can’t be that hard.

What does Grafana do that PowerBI doesn’t? I think I can just use PowerBI, along with Xibo.

When we started using Grafana PowerBI was… Less than stellar. We have alot of technical investment into grafana at this stage. Im not saying that One is better than the other necessarily. For us PowerBI might be something in the future or we’ll just hang out on Grafana.

I’m not sure about PowerBI but on Grafana we can have a dashboard that refreshes as quickly as every 10 seconds (or quicker). Makes it AMAZING for a partner screen at MES stations for machine data.

1 Like

To use Xibo locally, without paying for their hosted service, I need to install Docker. Can you talk about that at all? Do you pay for Docker service?

I have been researching this all day while messing around in Power BI. I think I have the basics.
Data Source: Epicor BAQ - Get v1 OData URL from REST helper.
Visualize the Data: Create Chart in PowerBI - Link to OData URL create above. Modify data as needed for visualization. Make the chart pretty.
Share the Data: Use PowerBI to export a live link to PowerPoint.
Put the data on the screen(s): Use Xibo to curate a list of useful PowerPoints, pictures, and/or videos, and display them on the screens based on a schedule.

Is this at least the basics?

It is my understanding that if you are running docker as a service on something like a linux VM (how we run it) you do not have to pay as it is not Docker DESKTOP which is the subscription requirement. I run Ubuntu LTS for hosting my docker containers and I use a project called Portainer to manage those. You can use the Docker Composer and a Composer script to make things super easy too if you so choose.

Yes I would say you have the basics down. One thing to note is that there is DIRECT PowerPoint integration, where it will load a PPTX in PowerPoint inside the Xibo Player but this is a WINDOWS only functionality and the low power little DSDEvices players that we use run a custom android so I export our PowerPoints to an MP4 video and let them play as a video.

If you can publish a ‘live link’ or whatever they call it as a weblink (loads in a Chrome browser) then you can load it in the DSDevice Android Player via a web page reference.

(EDIT)

Confirmed that the Docker Engine is still open and therefore freely available. It is Docker DESKTOP that is subscription modeled.

1 Like

I guess I don’t understand how Docker or the while VM thing fits into this.

So you need to host the software somewhere. Thats where Docker comes in. Think of the Docker Container as a VM. Its pre-built and runs totally separate from the host OS. You give it some customization variables and it downloads and starts everything up contained within that container.

A Linux VM comes in purely as somewhere to run Docker (as it is at its core a linux software package)

1 Like

Displaying data on digital signage is 101 for modern factories. Its amazing to me we bought such an expensive system and the best Epicor do is say “good luck idiot”. Why do we have to go through so much rigmarole to show data. This should be native to Epicor and was sold to us as such.

2 Likes

So you run a Linux VM, to run Docker, which is like a VM that runs Xibo, which sucks down data from PowerBI. Yeah, that’s not very native is it?

What do you run the Linux VM on?

They do have tools for this. Data Discovery, which a light version of is included free with the product. Data reporting, in general, is handled by different companies in a hundred different ways. Right wrong or indifferent. Complaining about this is a waste of time, they could spend thousands of hours trying to make every customer happy with reporting and never win.

I’m not sure why you would consider it rigmarole, you could put a PC on a TV and load a web deployed dashboard in 30 minutes if you really wanted to and never leave the Epicor ecosystem. Is that an ideal long term solution maybe for some yes. For us we prefer to make it more complicated and difficult on ourselves LOL

2 Likes

Yeah you virtualize so you can virtualize while you virtually virtualize your virtualization software. :wink:

Anyway… We run HyperV at the host level and Ubuntu 20.04 LTS at the Guest VM level and whatever the latest stable Docker version is at, I forget. Regardless of what the layering effect is the fact is it is worth doing.

2 Likes