I’d try running the Gen PO Suggestions for a limited set of parts. To see if it is a particular demand that is causing it.
If you use Part Class, do it for each class, one at a time.
I’d try running the Gen PO Suggestions for a limited set of parts. To see if it is a particular demand that is causing it.
If you use Part Class, do it for each class, one at a time.
Good point, could be a corrupt record or something, seen things like that too.
Another I’d do is make a BAQ for POSugg, and see what the last PO Suggestion (sorting by SuggNum) record that was created.
This assumes there is something wrong with the suggestion, and not a server timeout issue…
When I run the regen, all of the suggestions go away. If this next trial doesn’t work I’ll start looking at doing some individual group runs.
Ok, it’s probably something to do with the server. I’m getting this in the app server event log every time this happens:
Log Name: Application
Source: ServiceModel Audit 4.0.0.0
Date: 3/15/2020 4:38:16 PM
Event ID: 4
Task Category: MessageAuthentication
Level: Error
Keywords: Classic
User: N/A
Computer: <>
Description:
Message authentication failed.
Service: /EpicorERP/Ice/Lib/RunTask.svc
Action: Ice:Lib:RunTask/RunTaskSvcContract/RunSubTask
ClientIdentity:
ActivityId:
MessageSecurityException: The security timestamp is stale because its expiration time (‘2020-03-15T20:02:40.190Z’) is in the past. Current time is ‘2020-03-15T20:38:16.213Z’ and allowed clock skew is ‘00:05:00’.
Separate App and SQL servers? Are their clocks and time zones correct?
And I assumed that some PO sugg’s were created before it errored out.
You can open System Monitor and “watch” PO Suggestions run. Use the Active Task tab.
Yes, two app servers and one SQL server. They are all synced with our domain time server and all look to be currently synced. They are also all on the same time zone.
It finished with the suggestions and then moves to Orphan POs when I get the error.
Just because it’s related:
Do you have Service Connect or anything else that interacts with the PO Suggestion processes?
No, no service connect.
All three servers do have the same NTP settings. Let me check the VM host…
None of the VMs have host synchronization turned on. It’s weird because it’s saying that it’s stale when the current time is always more than the listed time mark. That time mark is always 10 minutes after I start the process…
Just to wrap this up. It took many calls to support, only to find out someone had changed the System Agent app server to https:// from net.tcp://
Once I changed it to match what the App Server setting was in the administration console it hasn’t died once.
What do you mean by system agent app server? the server that holds the task agent? Where exactly was it changed to https:// from net.tcp:// ?
I changed it from:
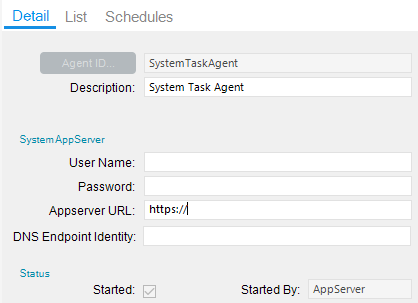
to:
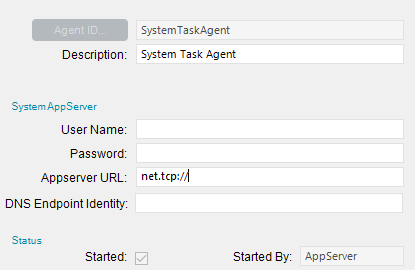
I removed the other info but it would be net.tcp://server/EpicorERP (or whatever instance you are running).
So the help info on this field would suggest this is only if you use a load balancer, and is an optional field. We do not use a load balancer and our current field is blank. But we are having the same types of socket timeouts at random. We have just implemented all of the additional timeout values per Epicor increasing them greatly but have not rebooted our Production servers for those settings to take place yet. Should I even mess with updating this field? Or just leave it blank still?
I’m not sure. We opted for a front end application server and a backend app server to handle printing, shipping, edi, etc… So we set ours for the backend. You could always put in the info to your application server and see if it helps.
So it is pointing to itself? Server-wise? In my case would I point it to the main App server or the App server that houses the Task Agent?
The App server that houses the Task Agent.
Thanks, we will give it a whirl!
I just got a notification yesterday they determined living it blank can cause timeouts.
Looks like it’s been solved.