MRP/PO Generation

We went live last week, and had a rough start due to continual server issues. One thing that is still affecting us is MRP/PO Suggestions will not run.

It dies on “Processing Orphan PO’s…” It doesn’t give me any details, it just stops. The log shows an IO error: A communication error occurred trying to run task ID XXXXXX for agent “SystemTaskAgent”

I have looked at linked POs and haven’t found any issues. Does anybody have any ideas on things I can look for? When I run it, it deletes all of the suggestions and I’ve ensured there are no lingering records in the suggestion tables. All of the POs for subcontract operations and buy materials are linked correctly on our jobs. We do not have any POs linked to Sales orders.

TIA

Doug,
What is the rest of the error message? There is usually a bit more that may confirm the root cause.
Also, can you confirm the version you have gone live on?
And, are you Single Sign On (SSO)?

Here’s the full stack message (the Generate Suggestions log just stops):

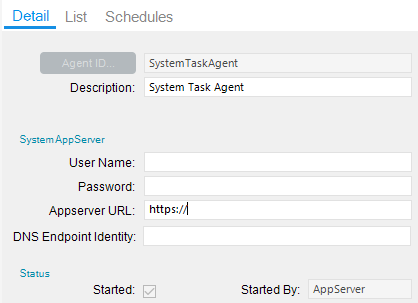
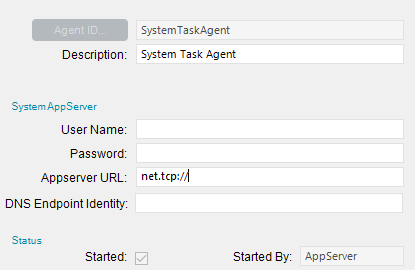
If this continues to happen investigate if you need to increase the receive and send timeouts in your web.config.
Error details:
System.ServiceModel.CommunicationException: The socket connection was aborted. This could be caused by an error processing your message or a receive timeout being exceeded by the remote host, or an underlying network resource issue. Local socket timeout was ‘1.00:00:00’. —> System.IO.IOException: The read operation failed, see inner exception. —> System.ServiceModel.CommunicationException: The socket connection was aborted. This could be caused by an error processing your message or a receive timeout being exceeded by the remote host, or an underlying network resource issue. Local socket timeout was ‘1.00:00:00’. —> System.Net.Sockets.SocketException: An existing connection was forcibly closed by the remote host
at System.Net.Sockets.Socket.Receive(Byte buffer, Int32 offset, Int32 size, SocketFlags socketFlags)
at System.ServiceModel.Channels.SocketConnection.ReadCore(Byte buffer, Int32 offset, Int32 size, TimeSpan timeout, Boolean closing)
— End of inner exception stack trace —
at System.ServiceModel.Channels.SocketConnection.ReadCore(Byte buffer, Int32 offset, Int32 size, TimeSpan timeout, Boolean closing)
at System.ServiceModel.Channels.SocketConnection.Read(Byte buffer, Int32 offset, Int32 size, TimeSpan timeout)
at System.ServiceModel.Channels.DelegatingConnection.Read(Byte buffer, Int32 offset, Int32 size, TimeSpan timeout)
at System.ServiceModel.Channels.ConnectionStream.Read(Byte buffer, Int32 offset, Int32 count)
at System.Net.FixedSizeReader.ReadPacket(Byte buffer, Int32 offset, Int32 count)
at System.Net.Security.NegotiateStream.StartFrameHeader(Byte buffer, Int32 offset, Int32 count, AsyncProtocolRequest asyncRequest)
at System.Net.Security.NegotiateStream.ProcessRead(Byte buffer, Int32 offset, Int32 count, AsyncProtocolRequest asyncRequest)
— End of inner exception stack trace —
at System.Net.Security.NegotiateStream.ProcessRead(Byte buffer, Int32 offset, Int32 count, AsyncProtocolRequest asyncRequest)
at System.Net.Security.NegotiateStream.Read(Byte buffer, Int32 offset, Int32 count)
at System.ServiceModel.Channels.StreamConnection.Read(Byte buffer, Int32 offset, Int32 size, TimeSpan timeout)
— End of inner exception stack trace —

Server stack trace:
at System.ServiceModel.Channels.StreamConnection.Read(Byte buffer, Int32 offset, Int32 size, TimeSpan timeout)
at System.ServiceModel.Channels.SessionConnectionReader.Receive(TimeSpan timeout)
at System.ServiceModel.Channels.SynchronizedMessageSource.Receive(TimeSpan timeout)
at System.ServiceModel.Channels.TransportDuplexSessionChannel.Receive(TimeSpan timeout)
at System.ServiceModel.Channels.TransportDuplexSessionChannel.TryReceive(TimeSpan timeout, Message& message)
at System.ServiceModel.Channels.SecurityChannelFactory`1.SecurityDuplexChannel.TryReceive(TimeSpan timeout, Message& message)
at System.ServiceModel.Dispatcher.DuplexChannelBinder.Request(Message message, TimeSpan timeout)
at System.ServiceModel.Channels.ServiceChannel.Call(String action, Boolean oneway, ProxyOperationRuntime operation, Object ins, Object outs, TimeSpan timeout)
at System.ServiceModel.Channels.ServiceChannelProxy.InvokeService(IMethodCallMessage methodCall, ProxyOperationRuntime operation)
at System.ServiceModel.Channels.ServiceChannelProxy.Invoke(IMessage message)

Exception rethrown at [0]:
at System.Runtime.Remoting.Proxies.RealProxy.HandleReturnMessage(IMessage reqMsg, IMessage retMsg)
at System.Runtime.Remoting.Proxies.RealProxy.PrivateInvoke(MessageData& msgData, Int32 type)
at Ice.Contracts.RunTaskSvcContract.RunTask(Int64 ipTaskNum)
at Ice.Proxy.Lib.RunTaskImpl.RunTask(Int64 ipTaskNum) in C:_Releases\ICE\UD10.2.500.5FW\Source\Shared\Contracts\Lib\RunTask\RunTaskImpl.cs:line 147
at Ice.TaskAgentCore.ServiceCaller.<>c__DisplayClass34_0.<RunTask_RunTask>b__0(RunTaskImpl impl)
at Ice.TaskAgentCore.ImplCaller.RunTaskImplCaller1.<>c__DisplayClass4_0.<Call>b__0(TImpl impl) at Ice.TaskAgentCore.ImplCaller.RunTaskImplCaller1.Call[TResult](Func2 doWork, ExceptionBehavior communicationExceptionBehavior, ExceptionBehavior timeoutExceptionBehavior) at Ice.TaskAgentCore.ImplCaller.RunTaskImplCaller1.Call(Action`1 doWork, ExceptionBehavior communicationExceptionBehavior, ExceptionBehavior timeoutExceptionBehavior)
at Ice.TaskAgentCore.ServiceCaller.RunTask_RunTask(Int64 sysTaskNum, ExceptionBehavior communicationExceptionBehavior, ExceptionBehavior timeoutExceptionBehavior)
at Ice.TaskAgentCore.ScheduleProcessor.CallServiceAction(SysTaskRow sysTaskRecord, SysTaskParamRow companyParamRecord, ServiceCallArguments serviceCallArguments)

Doug,
I am assuming you are on 10.2.300 as that is what your profile says.
So this is either caused by a TimeOut issue in your web.config, among other areas.
I doubt this is the issue because Epicor corrected the deployed TimeOuts by 10.2 … I thought.
But you are 3rd Party Hosted, perhaps they are still not correct.
TimeOutSettings_101100.pdf (65.5 KB)

Or you might just need to enable ‘Session Impersonation’ on the User Account that is running MRP/POSugg: Epicor KB: EpicCare Login - EpicCare

There could be other environmental configurations that are causing you issues.

I would recommend you send this to Epicor Support, this is relatively common and should be able to be corrected quickly with their help.

Sorry. I submitted before I meant to.

I’m on 10.2.500.5 now. We are on premise (with our servers at a datacenter).

We’ve never had this issue with any of our testing which makes me think something else weird is going on. I do have a ticket open with support, but I’m hoping to get this fixed today so the planners have some good data to work with tomorrow. I think I may know what the issue is. I’m trying another run now.

I’d try running the Gen PO Suggestions for a limited set of parts. To see if it is a particular demand that is causing it.

If you use Part Class, do it for each class, one at a time.

1 Like

Good point, could be a corrupt record or something, seen things like that too.

Another I’d do is make a BAQ for POSugg, and see what the last PO Suggestion (sorting by SuggNum) record that was created.

This assumes there is something wrong with the suggestion, and not a server timeout issue…

1 Like

When I run the regen, all of the suggestions go away. If this next trial doesn’t work I’ll start looking at doing some individual group runs.

1 Like

Ok, it’s probably something to do with the server. I’m getting this in the app server event log every time this happens:

Log Name: Application
Source: ServiceModel Audit 4.0.0.0
Date: 3/15/2020 4:38:16 PM
Event ID: 4
Task Category: MessageAuthentication
Level: Error
Keywords: Classic
User: N/A
Computer: <>
Description:
Message authentication failed.
Service: /EpicorERP/Ice/Lib/RunTask.svc
Action: Ice:Lib:RunTask/RunTaskSvcContract/RunSubTask
ClientIdentity:
ActivityId:
MessageSecurityException: The security timestamp is stale because its expiration time (‘2020-03-15T20:02:40.190Z’) is in the past. Current time is ‘2020-03-15T20:38:16.213Z’ and allowed clock skew is ‘00:05:00’.

Separate App and SQL servers? Are their clocks and time zones correct?

And I assumed that some PO sugg’s were created before it errored out.

You can open System Monitor and “watch” PO Suggestions run. Use the Active Task tab.

1 Like

Yes, two app servers and one SQL server. They are all synced with our domain time server and all look to be currently synced. They are also all on the same time zone.

It finished with the suggestions and then moves to Orphan POs when I get the error.

Just because it’s related:

Do you have Service Connect or anything else that interacts with the PO Suggestion processes?

No, no service connect.

All three servers do have the same NTP settings. Let me check the VM host…

None of the VMs have host synchronization turned on. It’s weird because it’s saying that it’s stale when the current time is always more than the listed time mark. That time mark is always 10 minutes after I start the process…

Just to wrap this up. It took many calls to support, only to find out someone had changed the System Agent app server to https:// from net.tcp://

Once I changed it to match what the App Server setting was in the administration console it hasn’t died once.

1 Like

What do you mean by system agent app server? the server that holds the task agent? Where exactly was it changed to https:// from net.tcp:// ?

I changed it from:

image

to:

image

I removed the other info but it would be net.tcp://server/EpicorERP (or whatever instance you are running).

So the help info on this field would suggest this is only if you use a load balancer, and is an optional field. We do not use a load balancer and our current field is blank. But we are having the same types of socket timeouts at random. We have just implemented all of the additional timeout values per Epicor increasing them greatly but have not rebooted our Production servers for those settings to take place yet. Should I even mess with updating this field? Or just leave it blank still?