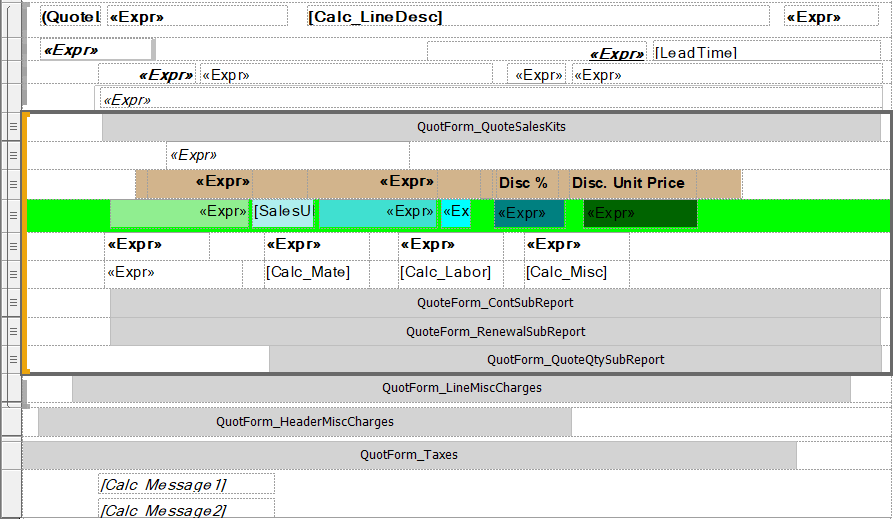
The line in green is the details for the Quantity Breaks (I colored it for testing so I could find it easily). When the report is generated, it puts each Quantity Break on a new line, which is to be expected.
What I am looking to do is condense that a bit. Right now it is basically:
Qty UOM Price /Per
But I want to take that from just 1 long list, and do it as 3 shorter lists so that it doesn’t take up a whole page.
Any ideas how I could go about that? I am thinking that there has to be a way for me to do something by hiding that row in the output, and then referencing the values in a new row to output it in a newly formatted way. But before I go and spend a few days getting that taken care of, I thought I would ask here to see if anyone else has tried anything similar.
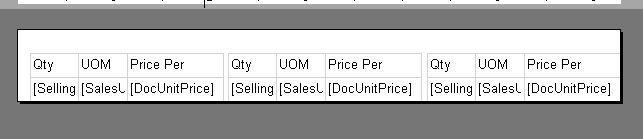
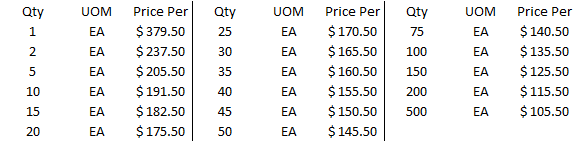
In Crystal Reports you could have made it a sub-report and set it up as three columns. Then you would have had
Qty  UOM  Price Per   |   Qty  UOM  Price Per   |   Qty  UOM  Price Per
1    EA     379.50        10    EA     191.50       25    EA     170.50
2    EA     237.50        15    EA     182.50       30    EA     165.50
5    EA     205.50        20    EA     175.50       35    EA     160.50
Play around with making a subreport of just the Qty Breaks.
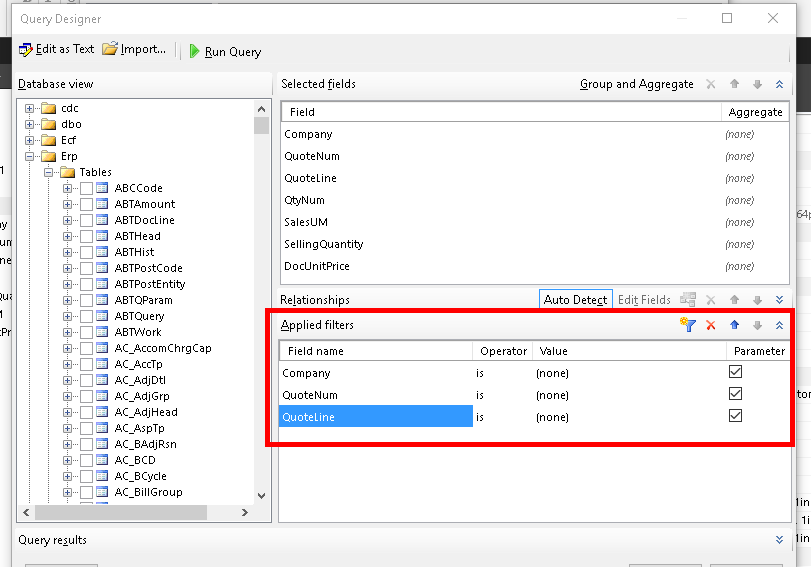
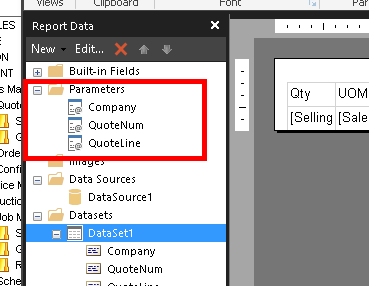
I’ll set up the three tablixes (tablixii? tablixee? tablixeses?) once I figure out how to create a subreport and pass parameters/data to it. I’ve never done this before. I’ve figured out how to add the Datasource, but creating the dataset(s) is throwing me for a loop. I assume I need to add it manually, just trying to figure out what the proper query needs to be.
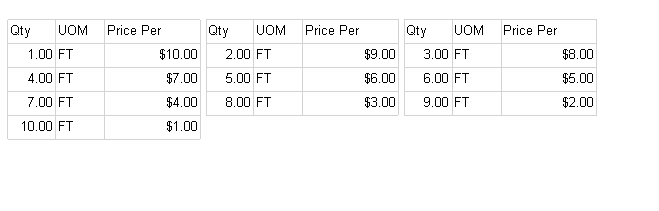
So I get this done, and it works exactly as expected. Looks great to me. I take it around to show the few people that it is going to affect so I can get their opinions. Each and every one of them asked if I could do the data up/down rather than left to right, such as this (from the post that @ckrusen made earlier):
Qty  UOM  Price Per   |   Qty  UOM  Price Per   |   Qty  UOM  Price Per
1    EA     379.50        10    EA     191.50       25    EA     170.50
2    EA     237.50        15    EA     182.50       30    EA     165.50
5    EA     205.50        20    EA     175.50       35    EA     160.50
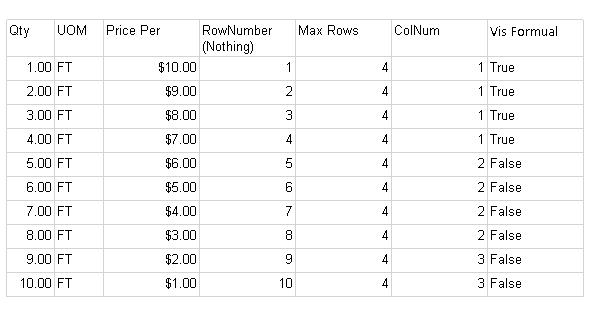
Unless I am overthinking this way too much, this wouldn’t be as simple as throwing a small calculation into the ‘visible’ fields for the 3 different tables. I would have to somehow figure out how many times 3 (the number of tables) goes into the total number of Quantity Breaks (lets say there are 17 of them) and then figure out what the best arrangement would be. In this case, for 17 there would be 6 in the first 2 tables, and 5 in the 3rdn as shown below.
For now, at least the design is done and everything fits snugly into the SSRS Report Designer (great tool, but it is a horrible piece of software).
@ckrusen - You replied to this thread, as I am sitting here with a coworker going over our options with this, and we both had that Eureka moment of dividing the row numbers by 3, rounding up, and throwing that data into the table. I think that with your information, and what I have jotted down on a napkin here, that I’ll be able to get this taken care of.