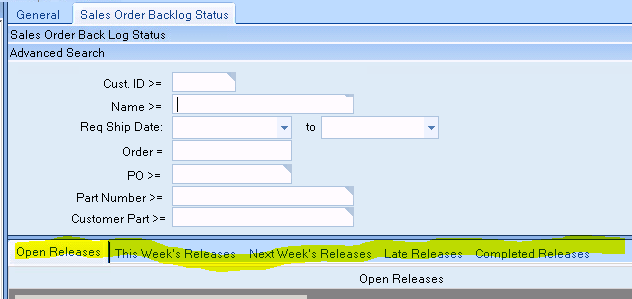
Can someone explain how the sheets/tabs are created in this Sales Backlog (Epicor) dashboard?
Can someone explain how the sheets/tabs are created in this Sales Backlog (Epicor) dashboard?
You cut off the tree view on the side that shows the different views from [likely] the same query.
I figured it out - thanks.