We could really use some ideas. On October 12th, our shipping folks started putting in help tickets for a pack slip sometimes taking 10+ minutes to finish (10.0.700.4). It’s killing thruput with hundreds of shipments a day… We submitted Case CS0001204749 to Epicor, along with a trace. 1st recommendation was to run the PDT tool, and we updated a few settings for the PDT recommendations, but there was no change. We uploaded the db too, as well as put it into our test environment, where it runs great (even with BPM’s enabled). The test environment shares the 1st app server, task server, and db server as LIVE.
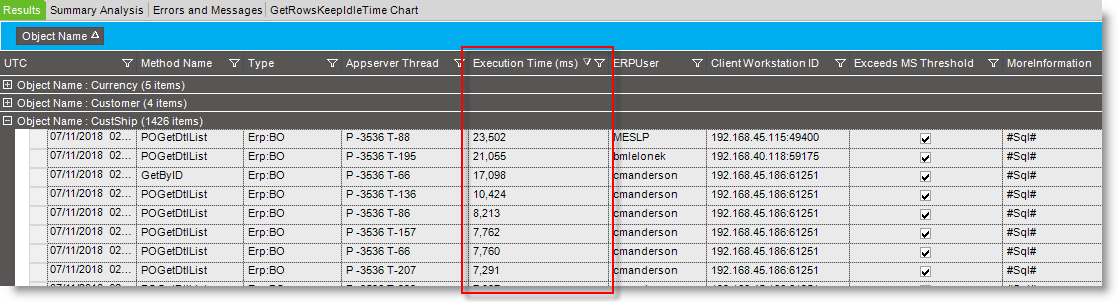
Looking at the trace, I see that the vast majority of the time is on the POGetDtlList method, with some calls running more than 1 minute (instead of milliseconds). FreightCarton is a distant second for consuming time. What can we do to figure out where the time is going? We haven’t been able to get anyone at Epicor to review the trace and offer suggestions beyond the PDT (yet… just got re-assigned yesterday, so I have hope, but we can’t recreate it on our test environment, so I don’t know if Epicor will either…).
What kind of additional logging can we turn on to get more detail on where the process is taking time? What other logs should we be looking at for clues? SQL Trace? Deadlocks? Windows Server logging? Indexing (although plopping the db onto our test environment has normal speed, so I’d think it’s not an index issue). I’m not a dba, but I can pass this info on to our team.
We’ve tried to back out any changes we made around that time (BPM’s, customizations, etc…), but the weird part is this copied db runs fine in our test environment.
Is it just that report? Or all reports? Did you set a delay on when the report data generates or does it generate and run immediately? The other thing that might be worth looking at is the fragmentation of the index on the po dtl table (maybe) if that call is taking forever it might be related. I seem to recall I had an issue once with that on a different table
Just curious if you are doing your shipments via Manifest? If so thats where you should focus. Its silly slow. We have the same problem and its mitigate-able but apparently not fixable.
@Aaron_Moreng - We do a weekly re-index on Saturday nights on the entire db. I’ll check into fragmentation there. This is on creating a pack slip in Epicor, not running a shipment report. The three steps our shipping folks mention a long delay are 1) create a packing slip, 2) print a shipping label , and 3) mark a pack as shipped.
@EarlGrei - We do use manifest, but it was working fast before, and we didn’t make any changes to that. Wouldn’t a delay there show up on the trace? It used to take <10 seconds to make a pack slip (up to 100 lines), and now it’s taking 2 to 12 minutes, even on small 2 line pack slips. We have non-manifest pack slips a few times a day. I’ll get details from our shipping dept on how those go. We also have a workstation named ‘Non-Insite’ that they will use.
@askulte We have the same issues, the slowness comes and goes and have yet to find the issue.
The Execution times don’t look too bad today, two days ago these values were double or triple and rebooting the servers solved the issue. We do not have Manifest.
Matt,
The slowdowns stopped a day before we applied Epicor’s data fix called “FX_Upd_Field_Case.sql”. This updated about 60k records with capitalization and trailing spaces…
I wrote something to grep the logs for manifest calls. Most of the time Manifest was sub .2 seconds per call - yes 1/5 of a second. The largest was about 1/2 second. After that we eliminated manifest as the reason for slowness.
Just to add a note here,it’s recommended to restart the Manifest app servers periodically. We restart ours weekly and have found this stabilized performance issues.
We’re on 10.2.400.10. The biggest problem we have is it is sporadic, which is why I don’t see how it could be a BPM. If it was a BPM, you would think the performance would always be poor.
This problem is turning out to be like a bad penny.
Started happening about 3 months ago, so we adjusted our maintenance plan to run nightly and rebuild indexes on ShipDtl table. We did identify that when the situation occurred, you could immediately inspect the server logs and see the POGetDtlList transaction go from 40 to 80 ms to 8,000 to 64,000 ms. If we rebuilt indexes in middle of day, problem vanished immediately.
You can run this query and see large fragmentation on several of the indexes.
select OBJECT_NAME(ips.OBJECT_ID), i.NAME ,ips.index_id ,index_type_desc ,avg_fragmentation_in_percent ,avg_page_space_used_in_percent ,page_count
FROM sys.dm_db_index_physical_stats(DB_ID(), OBJECT_ID(N’erp.ShipDtl’), NULL, NULL, ‘SAMPLED’) ips
INNER JOIN sys.indexes i ON (ips.object_id = i.object_id)
AND (ips.index_id = i.index_id)
ORDER BY avg_fragmentation_in_percent DESC
I then started playing with the freespace on several of the indexes that were fragmenting during the day. The following seems to have reduced or eliminated the fragmentation:
alter index IX_ShipDtl_SysIndex on erp.ShipDtl rebuild with (FILLFACTOR = 90)
alter index IX_ShipDtl_CustNumOurPart on erp.ShipDtl rebuild with (FILLFACTOR = 90)
alter index IX_ShipDtl_CustNumCustPart on erp.ShipDtl rebuild with (FILLFACTOR = 90)
alter index IX_ShipDtl_UnShippped on erp.ShipDtl rebuild with (FILLFACTOR = 90)
alter index IX_ShipDtl_WarrEffDate on erp.ShipDtl rebuild with (FILLFACTOR = 90)
alter index IX_ShipDtl_WarrLabExp on erp.ShipDtl rebuild with (FILLFACTOR = 90)
alter index IX_ShipDtl_WarrMatExp on erp.ShipDtl rebuild with (FILLFACTOR = 90)
alter index IX_ShipDtl_LastExpiration on erp.ShipDtl rebuild with (FILLFACTOR = 90)
alter index IX_ShipDtl_ShpConNum on erp.ShipDtl rebuild with (FILLFACTOR = 90)
alter index IX_ShipDtl_PartNum on erp.ShipDtl rebuild with (FILLFACTOR = 90)
Now we’re on to a new culprit causing the slow down and I haven’t yet identified which function is running slow. I suspect the table is now the issue as it approaches 1 million rows.
Several questions for the community:
How many rows do you have in erp.ShipDtl table?
Has anyone changed freespace on the table itself?
Anyone run a purge of rows on an annual basis to try to keep the table smaller?
Would it benefit from rebuild of the table?
Any ideas on what else to look for?