Brand new DMT of a PO. Lines 1-20 process promptly, 21-40 are slow, and 41-60 slow to the point where they barely finish. Greater than 30 minutes for the whole thing.
We are on 10.2.300.16 and this is true of manually created purchase orders as well. Anyone else seeing this issue?
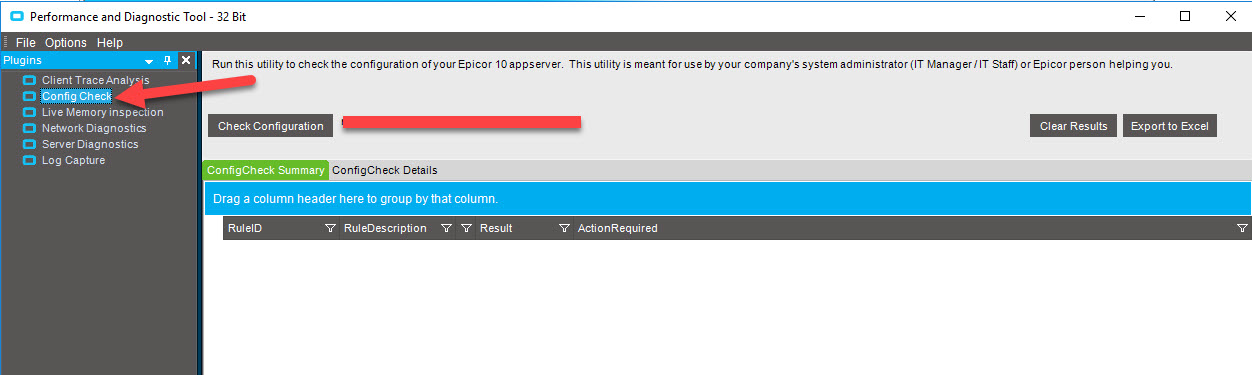
This is awfully slow. In my opinion, whether you have customizations/BPM (customizations are not raised through DMT, so BPM are your target) that are slowing down the process or the servers are just not strong enough. I suggest that you run the Performance Diagnostic Tools and validate your configurations.
I also ran the PDT test as requested and there were some warnings/fail on CPU but I believe this to be normal when we have an existing production load on the CPU? Do you agree or should this pass regardless of load?
We have one T flag failing that we are confident we addressed prior to moving to production but we will look to get that addressed again.
I also ran the PDT test as requested and there were some warnings/fail on CPU but I believe this to be normal when we have an existing production load on the CPU? Do you agree or should this pass regardless of load?
I’ve not ever seen CPU warnings on my systems, whether under load or not. I would check that out, ensure that all the power settings are as they should be for maximum performance rather than balance performance or power saving.
Also sql indexing springs to mind - I’ve had a slowdown on a particular screen before and I found it to be because the maintenance scripts weren’t setup (when I first started at my company) and this process had just gotten slower and slower over time. Check indexing.
Try turning off the ready to process option for POs in Company Config and try again…I saw a huge performance improvement when we did that. From 4 minutes per PO with 100 lines to 14 seconds for 100 lines
I don’t know the details of the version, use or module but when I hear progressively slower certain scars …errr… alarm bells ring.
It’s been too common pattern a pattern I’ve seen where more and more rows to the payload being sent back and forth across between client and server and it causes a slow down based upon exponentially duplicating records in the DataSet. e.g. - save row 1, 1 record back and forth. Row 2 does 3, 4 does 6, etc.
Usually I can turn on the client trace with full details (or equivalent in other solutions) and see the payload exploding in content. Its a quick check to see if that is the scenario. If it is, then start diagnosing where did all that extra data come from? Too often its a naïve client customization (or equivalent in client module code).
No. I mentioned above that I have seen the pattern regularly against E10 and other products in general
I do not have enough domain expertise in DMT to comment on the exact issue but a generally degrading service often is a sign of the payload increasing overtime. Just a tidbit to think about when diagnosing.
I’m looking at setting up a more recent copy of our live environment to see if I can reproduce the issue and then try this. Users won’t adapt well to this sudden change in live. I appreciate the heads up and I’ll report back soon.
You could just test this for one PO copy the lines from one PO, create a new PO, turn off ready to process then do a paste insert, all the while doing a trace and then save your trace and examine in the Performance Diagnostic tool…You will see exactly the method that is causing the pain.