Rogue App Server Flooding SQL with 10K Queries a Minute HELP!

10.2.500.27
So 2 days ago we populated this field

In System Agent because we were trying to run some reports via REST and it required that field. Soon after and unbeknownst to us performance in the system Tanked and has been tanked for 48 hours.

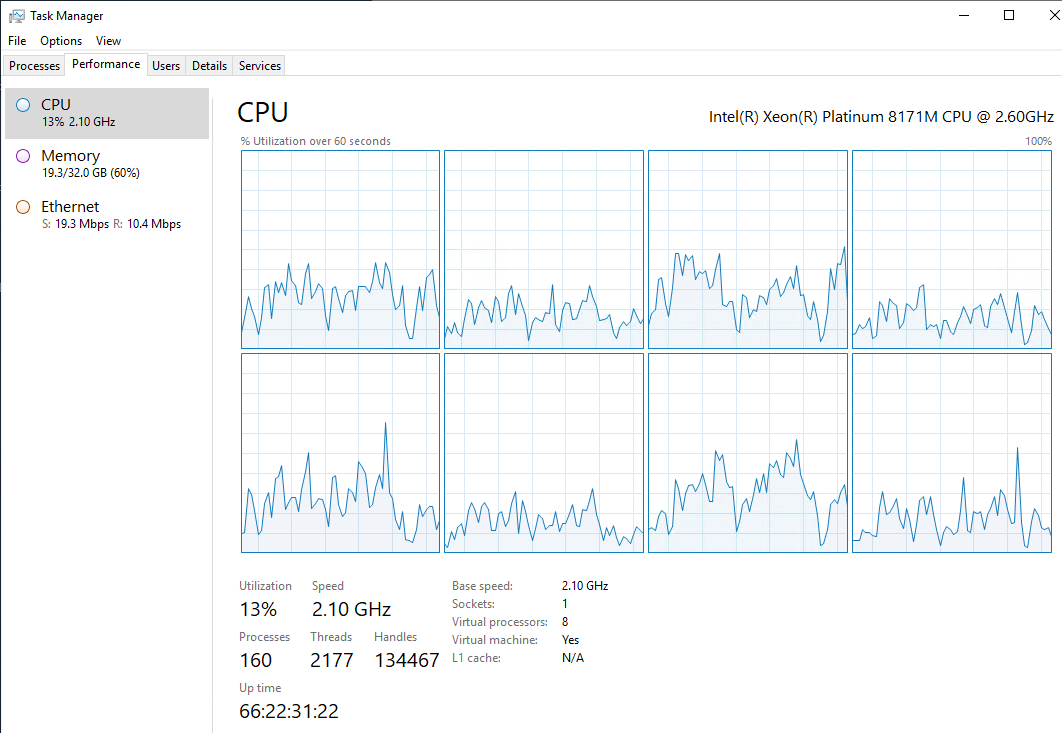
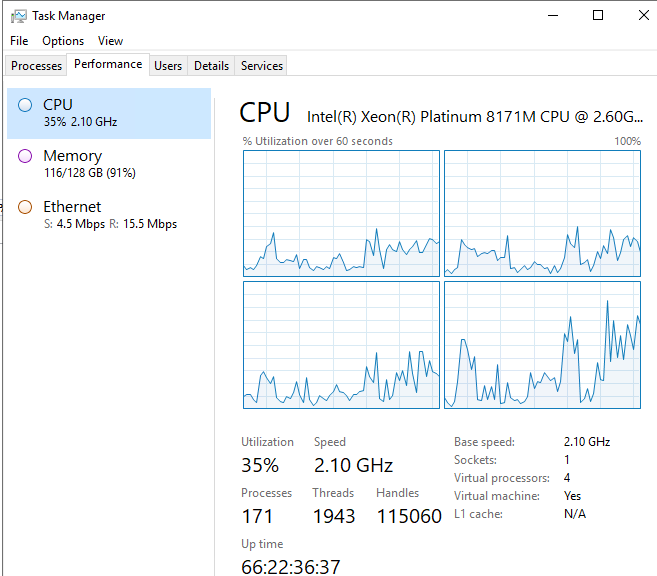
SQL Server is Pegged at 100% and I haven’t been able to find which “bad query” is causing the issue.
After much testing and prodding I realized that app01 (the server which hosts our System Agent Task Service / and Printing App Server) was also pegged

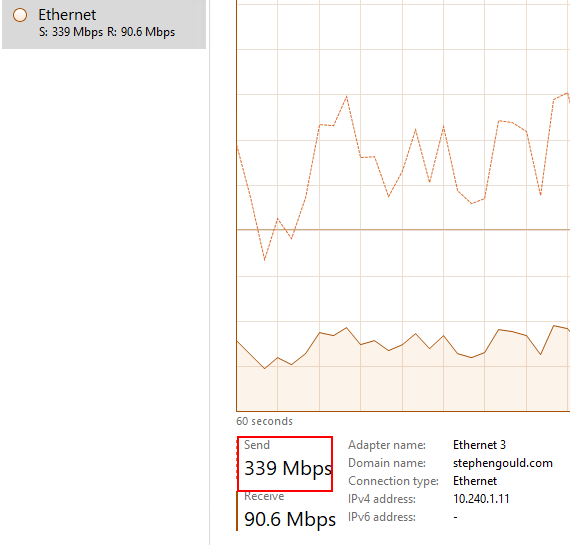
I soon realized that turning off that App server also relieves the issue in SQL. We are throughputting 300Mbps of traffic from App01 to SQL

After much testing and messing I used profiler to determine that the App server is just running wild with queries to the TaskParam table.
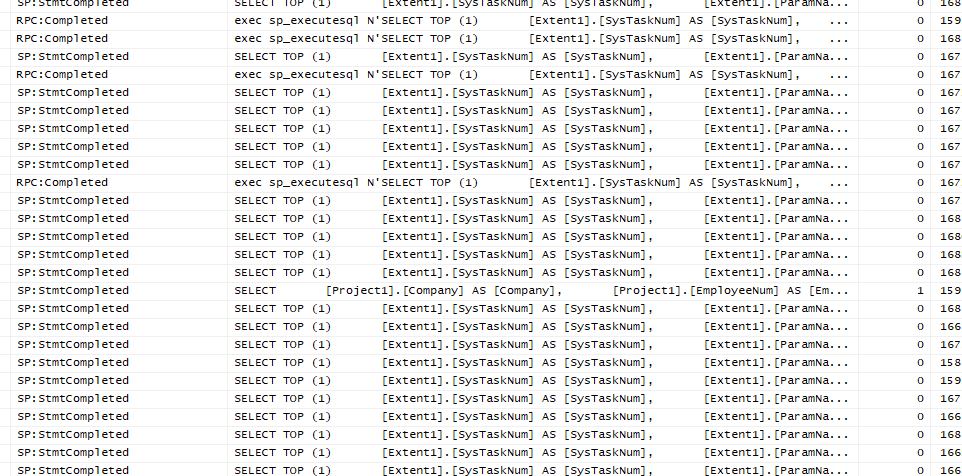

image

SELECT TOP (1) 
    [Extent1].[SysTaskNum] AS [SysTaskNum], 
    [Extent1].[ParamName] AS [ParamName], 
    [Extent1].[ParamLabel] AS [ParamLabel], 
    [Extent1].[ParamType] AS [ParamType], 
    [Extent1].[ParamDataType] AS [ParamDataType], 
    [Extent1].[ParamCharacter] AS [ParamCharacter], 
    [Extent1].[ParamDate] AS [ParamDate], 
    [Extent1].[ParamLogical] AS [ParamLogical], 
    [Extent1].[ParamInteger] AS [ParamInteger], 
    [Extent1].[ParamDecimal] AS [ParamDecimal], 
    [Extent1].[ParamToken] AS [ParamToken], 
    [Extent1].[SysRevID] AS [SysRevID], 
    [Extent1].[SysRowID] AS [SysRowID], 
    [Extent1].[ParamLong] AS [ParamLong]
    FROM [Ice].[SysTaskParam] AS [Extent1]
    WHERE ([Extent1].[SysTaskNum] = @p__linq__0) AND ([Extent1].[ParamName] = @p__linq__1) AND ([Extent1].[ParamCharacter] IN (@p__linq__2,@p__linq__3))

Over and over again up 10K times a minute, we have recycled, the app server and even spun up a completely separate System Agent elsewhere and turned / killed this one off.

But this appserver specifically continues to do this, we can’t seem to stop it even with turning it off compeltely as soon as we turn it back on it goes insane again.

We don’t want to detroy it (delete it) because other apps rely on it. We already removed the appserver URL form System Agent Maintenance but that didn’t seem to help.

Note this app server is NO LONGER BEING USED for ANYTHING other than for some “REST” calls from the Hand Held. Yet it continues to hammer SQL at 10K queries a minute all the same.

HELP!!!

@Patrick.Ferrington @Edge @aidacra

Can you enable server logging and flag trace://ice/fw/sysagenttask?

No idea what it does but seems to be the only that could provide additional info related to agent tasks.

That didn’t do anything unfortunatelly. No new traces in the ServerLog.

Anything on what was already logged that indicates which BO is getting hit that could be triggering the queries? Also maybe try the restapi trace flag, maybe that will show something.

RestAPI flag does show rest calls from the hand held but nowhere near enough to warrant several thousand query’s per minute all to the task table :disappointed:

Try flags
“profile://system/db/stacktrace”
“trace://system/db/hits”

Also, is there a task stuck as “ACTIVE”? Something maybe running that it shouldn’t? Are there a bunch of tasks scheduled at the same time?

On pure chance I triggered this same issue this week. Monday at 12:05pm I was trying to setup multi-company processing in our pilot (2021.1) we just purchased the module. I noted that I never updated that AppServer from our production URL (different physical server) before I started the task agent. By 12:57pm our testing system was unusable. In our case just updating that URL and restarting the windows service worked to clear out the issue. Up until then I saw the same behaviour SQL was really mad and the AppServer was really mad but nothing was actually happening far as we could tell. I eventually narrowed it down to the task agent. That lead me to the System Agent screen, I found the URL issue, corrected that, issue was not gone, so at that point did the when in doubt restart services.

I can say in my case I had tasks queued to run but nothing was stuck stuck like what can happen sometimes, and when working with Jose on this today there was nothing running for tasks on the AppServer in question. Because of it’s degraded state it was being used for nothing but a few handhelds in their company.

Also, in the trace do the parameters for the query to SysTaskParam tell you anything?

There are no active stuck tasks.

And these two flags produce a metric ton of stuff but none of it is related to tasks and task params :frowning:

No they appear to be different TaskNumbers every time

exec sp_executesql N'SELECT TOP (1) 
    [Extent1].[SysTaskNum] AS [SysTaskNum], 
    [Extent1].[ParamName] AS [ParamName], 
    [Extent1].[ParamLabel] AS [ParamLabel], 
    [Extent1].[ParamType] AS [ParamType], 
    [Extent1].[ParamDataType] AS [ParamDataType], 
    [Extent1].[ParamCharacter] AS [ParamCharacter], 
    [Extent1].[ParamDate] AS [ParamDate], 
    [Extent1].[ParamLogical] AS [ParamLogical], 
    [Extent1].[ParamInteger] AS [ParamInteger], 
    [Extent1].[ParamDecimal] AS [ParamDecimal], 
    [Extent1].[ParamToken] AS [ParamToken], 
    [Extent1].[SysRevID] AS [SysRevID], 
    [Extent1].[SysRowID] AS [SysRowID], 
    [Extent1].[ParamLong] AS [ParamLong]
    FROM [Ice].[SysTaskParam] AS [Extent1]
    WHERE ([Extent1].[SysTaskNum] = @p__linq__0) AND ([Extent1].[ParamName] = @p__linq__1) AND ([Extent1].[ParamCharacter] IN (@p__linq__2,@p__linq__3))',N'@p__linq__0 bigint,@p__linq__1 nvarchar(4000),@p__linq__2 nvarchar(4000),@p__linq__3 nvarchar(4000)',@p__linq__0=3701391,@p__linq__1=N'ProcessStart',@p__linq__2=N'Start',@p__linq__3=N'Failed'

Note in this example they are looking for TaskNum 3701391

It is worth nothing there is only one record in the whole table which meets the two Criteria
Paramname=‘ProcessStart’ and ParamCharacter in ‘Start’ or ‘Fail’

BUt it has a different TaskNum

It belongs to a failed Multi Company Direct Process

SysTaskNum TaskDescription TaskType StartedOn EndedOn SubmitUser TaskStatus Company AgentID AgentSchedNum AgentTaskNum RunProcedure InitiatorSource ActivityMsg History TaskNote LastActivityOn UserPIDInfo ProcessID IsSystemTask SysRevID SysRowID ProgressPercent
3693502 Multi-Company Direct Server Process Process 09:06.7 10:19.4 manager Error C004 SystemTaskAgent 437 1 Erp.Internal.SI.SIM130.dll Agent 1 1 10:19.4 MCD 0 0x00000000357C0694 F4766858-A1FD-485C-ABD6-C1C9A8F04557 5

Note at the bottom how many queries are coming In I clear it and withi seconds we got tens of thousands. Note this profile trace is specifically narrowed to this one AppServer that has gone rouge
https://s9.gifyu.com/images/CrazyTasks.gif

Do you have Retry Feature Enabled and/or still lurking registered TA.

SELECT * FROM Ice.ExtServiceRegistration;
SELECT * FROM Ice.EnabledFeature;

Both of those are correct…
However… I just realized something… those task numbers it is trying to find… they don’t exist on the Db at all…

So now I’m even more confused where the heck isit getting those TaskNumbers from?

Well… I apologize in advanced for the string of curse words that follows…

JESUS 48 HOURS OF HELL FOR SOMETHING SOOOOOOOOOOOOOOOOOOOOOOOOOOOOOOOOOOOOOOOOOO STUPID…

For the future poor bastard here’s what the issue was. And it was in fact the EXACT same issue that Josh had… F******************************************CK!

Note on my first post I alluded to having populated the AppServerURL here in Live a cuple of days ago

The other thing we do quite often is clone Live into other environments for Development and Training purposes. So about… 48 hours ago, we cloned live into the train Db. I believe that’s enough for you to go… ohhhhhh shit…

But for those who want more… when we cloned the DB that field carried through which means that now Epicor Train was sending all its “Tasks” to the Live_DocStar AppServer (for production)

The way that Epicor works is it looks at the pending tasks , picks the first one, marks it as “TAKEN” and starts working on it. The problem is that when the Training App Server took that one Task and “marked it as taken” it was doing so with the Live AppServer which promptly said… I don’t know what the hell that task is… and shrugged its shoulders. In the next loop, the same task was already there and so the app server dutifully sent the task for processing… ad-infinitum.

Over 48 hours Tasks Accumulated in Train (a lot of Multi Company Processes run every 5 seconds) and well you can see what can happen, there are thousands of Tasks in the Immediate Run Request in Train that were constantly being “picked up” by the Live App Server but never told whether the task completed or failed. So it tried and tried again.

Current Status

Thank you sooooooooooo much @Jonathan @hkeric.wci @jgiese.wci @Banderson @hmwillett @Chris_Conn the entire community of Brent Ozar over in slack, special mention to [alevyinroc] who called out the 10K batches per second load during some troubleshooting yesterday… which eventually lit the bulb that lead to this solution and my poor poor users…

on to fight another day…

@Epicor… for the love of God verify that the Db’s are the same when the Appserver sends tasks to the Task Agent… Save a life… :tired_face:

Further more that query it kept running over and over again was specific to Multi Company Processing.

CC: @JeffLeBert please buddy do a HMAC verification or something to let the AppServer know the request came from the “right” Db anything… anything bud! Save the next guy

12 Likes

Only just read this, if I had seen this post sooner I might have saved you some stress. We had this issue as well. Copy Live to Test and some time later the CPU in Live would goto 100%. We also have multi company process set on a 30 minute schedule so it would take until the next 30 minute process for the issue to trigger. I also found I had to reboot the Live server to stop it once it had started.

Brett

I’d just like to point out while we were on zoom I asked you if you were sure no other databases were pointing at that task agent and you just did a lot of grumbling.

That is all I came back for, an “I told you so” LOL :grin:

Can’t believe this, I thought I was the only one… I did this the next day after we did the upgrade and everything was incredibly slow. Was lucky enough to spot it early but I feel your pain.

LE: I just saw you’re using MCDSP - check the logs on the server for any errors as well as the IntQueIn and IntQueOut for any weird stuff. But you probably know this.

1 Like

Yes yes but this was already at the end of the 46th hour… and well… (i won’t say this again so frame it)… “You were right Josh” :face_vomiting:

1 Like