Is there a way to start the kinetic page with debug logging status set to true? I’ve read the article on Development Tools & Debug Logging, and I was able to get the classic client to log to a file, but it doesn’t log the events like it does with debug logging status set to true. I’m trying to find out which events are occurring before I have the chance to Ctrl+Alt+8.
2 Likes
You can enable debug mode when you are on the main menu and it will log all the events as you’re navigating around in that same tab.
But to answer your question, I haven’t found a way to keep the debug mode on.
You can turn it on globally by modifying the sysconfig.json file on the server.
2 Likes
Thanks!
Is there any workable solution for SaaS you know of?
The snarky side of me wants to say “Yeah! Move back on prem!” ![]()
I don’t honestly know; SaaS isn’t my jurisdiction. @klincecum do you know if you can enable debugging globally for SaaS?
2 Likes
I followed that article, but it did not produce the events. It only produced the normal log when the debug logging status is false
I’m SaaS, what server?
![]()
I haven’t used it in a while, but after modifying the sysconfig.json file, you need to recycle the app pool.
Note–this is not the sysconfig file in the client folder. It’s on the sever \inetpub\wwwroot\<AppServerName>\Server\Apps\ERP\Home

![]()
![]()
2 Likes
Does adding this under “UserSettings” section --of the client Sysconfig file work?
<LaunchEOBrowserDebug value="True" />
I’m glad to see your position hasn’t changed… I just saw this again the other day and this current post made me go find it again:
2 Likes
I’m consistent if nothing else. ![]()
1 Like
The specific addition you would need is this one:
"ep.metafx": {
    "debug": true
}
1 Like
I was meaning the local sysconfig file not the serverside one. You know, for us SaaS folks. But that’s smart client only.
2 Likes
Yes that is the way I have had it before. Same way Sham taught me when I had the training from Epicor.
I don’t think so unfortunately.
I was able to get this to work. It’s a little hacky, but at least it is working. I created a dummy page that will launch the view/layer I want to debug from open using an app-open event widget. I launch the dummy page, turn on debug logging, then trigger the event to launch the view/layer in another tab. Then I grab the URL from the launched tab, paste it into the URL bar for the dummy page, and hit enter, and it debug logs the events from page start up, including row rules and everything. For my screen, it also carried through the launch options and key initialized values.
So it seems as if we could get this to easily work if there is a way to launch an app, using app-open in the same tab we’re in?
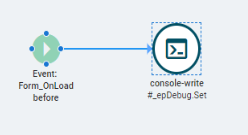
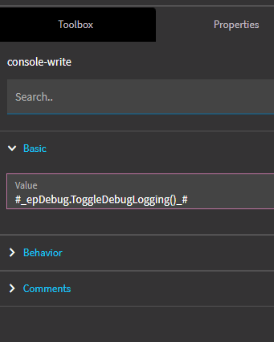
You can enable debug logs automatically in a Kinetic customization layer by adding an event that triggers on form load, with a console-write widget, with #_epDebug.toggleDebugLogging()_# as the argument.
7 Likes
Thanks @HLalumiere, that certainly would have saved me some time over the last couple of days. Your solution is much easier. Does it list out all the row rules as well? I didn’t need that for my issue this run, but I can see how that would be helpful.
If there is a console command to list the row rules, you can certainly invoke that as well… You can experiment by opening the console, and typing epDebug. .The Intellisense will show you what you can call. In the event, just add a second (third, fourth…) console-write widget with each debug command you want to run…
Just don’t forget to turn it off before shipping to prod.