I didn’t realize you already wrote this up, saw it as I was replying to another thread.
In addition to the Browser Debug, here is additional Client-Side Info, for the sake of information.
If you are using Epicor Client
You can visit this url in the browser http://localhost:1234/ and get to Chrome Remote Debugging Tools.
You can also enable some text file logging as well as change the Remote Debugging port by adding the following to your client .sysconfig under <userSettings>
    <EOBrowser>
      <RemoteDebugPort value="9876" /> <!-- set custom port if you have issues with 1234 -->
      <LogEnabled value="true" bool="" />
      <LogPath value="C:\epicor\debug\foldertologto" />
      <!-- <ExtraCommandLines value="--disable-image-loading" /> -->
    </EOBrowser>
You can also launch a Dev Console during Start by adding the following to <userSettings>
<LaunchEOBrowserDebug value="True" />
I also believe you can click F12 while in a Kinetic Screen including iDP Client.
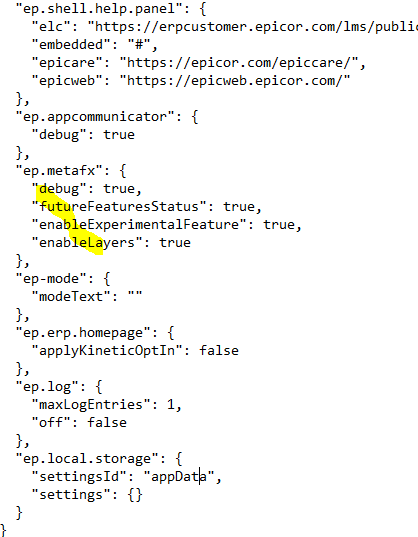
If you want to Enable Debug Mode for everyone
Not sure why you would, but you can also add additional flags to your sysconfig.json