What's the best IDE to use to develop/debug code with?

I’m not even sure if this is possible but I’ve been developing/debugging code with a simple text editor and a ton of message boxes. This is inefficient at best.

Wondering if there’s a tool like Microsoft Visual Studio that can plug into Epicor code, set breakpoints, evaluate and edit variables in real time, etc.

Any tips and links to how to set this up to work with Epicor would be GREATLY appreciated.

Thanks for your time.

1 Like

@Gregory_Leepart, that extension will pull your customization into visual studio so that you can code with auto complete. The debugging part already existed in Epicor, you click on the debug checkbox when you open the customization, and it will open in VS and allow you to run with break points and debug.

BPM’s (server side) is a lot harder…

On BPMs I use VS to code and the app server event viewer to get error messages or progress of the BPM.

The event viewer will give you the routine and sometimes the line number of the error.

image

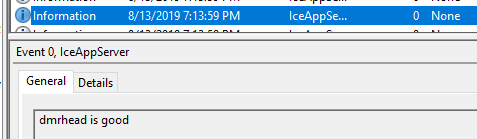
If you don’t get line numbers add log entries to follow the process like below.

Ice.Diagnostics.Log.WriteEntry(" email from is good" + EMAIL_From);
DMRHead = Db.DMRHead.Where(DMRHead_Row => DMRHead_Row.Company == ttDMRActnRow.Company && DMRHead_Row.DMRNum == ttDMRActnRow.DMRNum).FirstOrDefault();
Ice.Diagnostics.Log.WriteEntry(" dmrhead is good");

image

When you do get a line number it is referencing the whole routine and not just your BPM, so you need to load the source file from the app server to find the number and it is not always the exact number. could be a line before or after. The number at the end is a directory that is generated with each BPM save. \c-e10app1\d$\Epicor\inetpub\wwwroot\Pilot\Server\BPM
For this Data Directive.
\c-e10app1\d$\Epicor\inetpub\wwwroot\Pilot\Server\BPM\Sources\DT\ERP.DMRActn.Triggers\13

if you have an entry in the event viewer that you are not sure what BPM wrote the entry you can use @hkeric.wci’s tip below on using grep in CMDER to find all routines that have a section of code in them. I have found this invaluable in the past month.

So @Banderson is correct that it is harder than stepping thru in VS, but with the right tools it is doable.

4 Likes

The Extension is AWESOME! Having intellisense is fantastic learning tool, especially for the accidental developers among us.

3 Likes

Intelisense is a fantastic tool for the seasoned developers among us, too. (Why use a screwdriver when you can use a power drill!) @josecgomez has done an outstanding job creating such a useful add-on.

3 Likes

Ok… I really just want to debug, set breakpoints, view/edit variables.

I’m in Dev mode, open the form, select my customization, right click and select Customization, now where do I find the debug checkbox?

When you run a customization in developer mode, there is a Debug In Visual Studio checkbox on the bottom left of the selection screen

However the visual studio plugin above allows you to write the entire customization in visual studio too.

Unfortunately, mine is greyed out.

image

As for your customization, it crashes as soon as I click Open. Not sure if I’m pointing to the wrong Client folder but I’m pointing mine at C:\Epicor\ERP10\ERP10.1.600.0\ClientDeployment\Client

Download folder is to one on my desktop. DNSpy I have no idea what it is and it sounded optional in your video so I left it blank.

Thoughts?

Yes that is the wrong client folder it should be the same place you are running you epicor application from.
Also you need to make sure you downloaded and installed the appropriate helper library for your version of Epicor. In your case it is this one
https://josecgomez.com/files/CustomizationHelper.10.1.600.X.zip?0.43.0
And that needs to be unblocked and extracted into the Epicor client folder.

If your Debug In Visual Studio is grayed out is because you do not have Visual Studio installed.

Ok. Change Client folder to “C:\Epicor\ERP10\LocalClients\ERP1016Production” based on path found in properties of shortcut used to launch Epicor.

Extracted customization files into folder. It wanted to overwrite System.console.dll but I said no, renamed the original and then copied yours in. Anyways, your customization appears to be working as I got to the sysconfig screen.

I just signed into VS, thought maybe that was the issue but still greyed out Debug checkbox. User maintenance checkbox maybe?

Does your customization allow debugging or just autocomplete code writing and all your fancy pants tools?

It does both but for debugging you need DNSpy which is a separate tool to install. The epicor debug checkbox is version specific for your 10.1.600 you need to install visual studio 2015 for debuging with the Epicor version.

lol… omg. Ok, I’ll check out DNSpy first and if no love there I’ll get 2015. Silly cuz we’re going to 10.2 in the next couple of weeks.

Thanks for you help! Have a great weekend.

1 Like

Actually, we have a DEV server that we’re testing 10.2 on. I could install 2017 on it. It’s compatible with that version right?

1 Like

Yes I believe so.

After attempting many combinations, here’s what I can say.

VS 2019 or 2017 Community does not integrate with 10.2.

I had thought I was missing a component, extension, or library… but

VS 2015 works with 10.1.600 right away, just install and it immediate shows the Debug in an accessible way.

Hope this helps someone.
G

1 Like