Users started reporting extremely poor performance ~10 minutes ago in all actions taken in the browser (loading forms, loading data, etc), to the point where the application appears broken. This is adding insult to injury with all the other issues 
… and it appears to be back.
Intermittently, yes. Support says everything is fine whenever I try to report it. I have now used AI to analyze the logs and extract specific events that are 10-50x slower than the same event prior to the linux migration. Waiting for support to respond to that.

Yuuuuuuuuuup. Had two jobs randomly die on a SQL connection-reset-by-peer message midmorning. Still seeing random DataReader and DbUpdateConcurrencyException on base apps like Packing Slip Print and Material Queue Report.
That is the frustrating part. By the time the ticket is acknowledged, the problem has resolved itself and support says “Everything looks fine”. Good work on the logs, what sort of events are slower than before?
The one that is the most eggregious is marking shipped on a pack. Went from ~1-2 seconds to 30+ seconds.
Our shipping guys are screaming about it too.
I threw this on another thread somewhere, but I do think we all should use a tool to track/benchmark performance of common queries, etc. so that we can clearly all state it’s an issue. like PDT but for cloud.
We have that . . . download server logs, explain problem to ai and feed it the logs.
Nobody can connect anymore…
we can connect
Our company lost connection for 10 mn. We are back now. What a week.
anybody have issues this past week with edge agent prints not going through?
Slow like usual.
Yes a few users reported that
I went a fair way in this direction some time back. Maybe as recently as 12 months ago? I saw what I considered a performance issue in a Public Cloud Pilot environment, and since I was presenting a workshop at the time, it levered me into action.
I made a simple EFx that calls “GetRows” on about 9 BOs (Jobs, Sales Orders, Purchase Orders, Parts, AR Invoices etc) and I assume gets ~100 rows back for each. Scheduled that every hour or so, and came back later.
Then a BAQ and Excel to see what it looked like. I chased it a bit further, and then left it with a few customers who were interested.
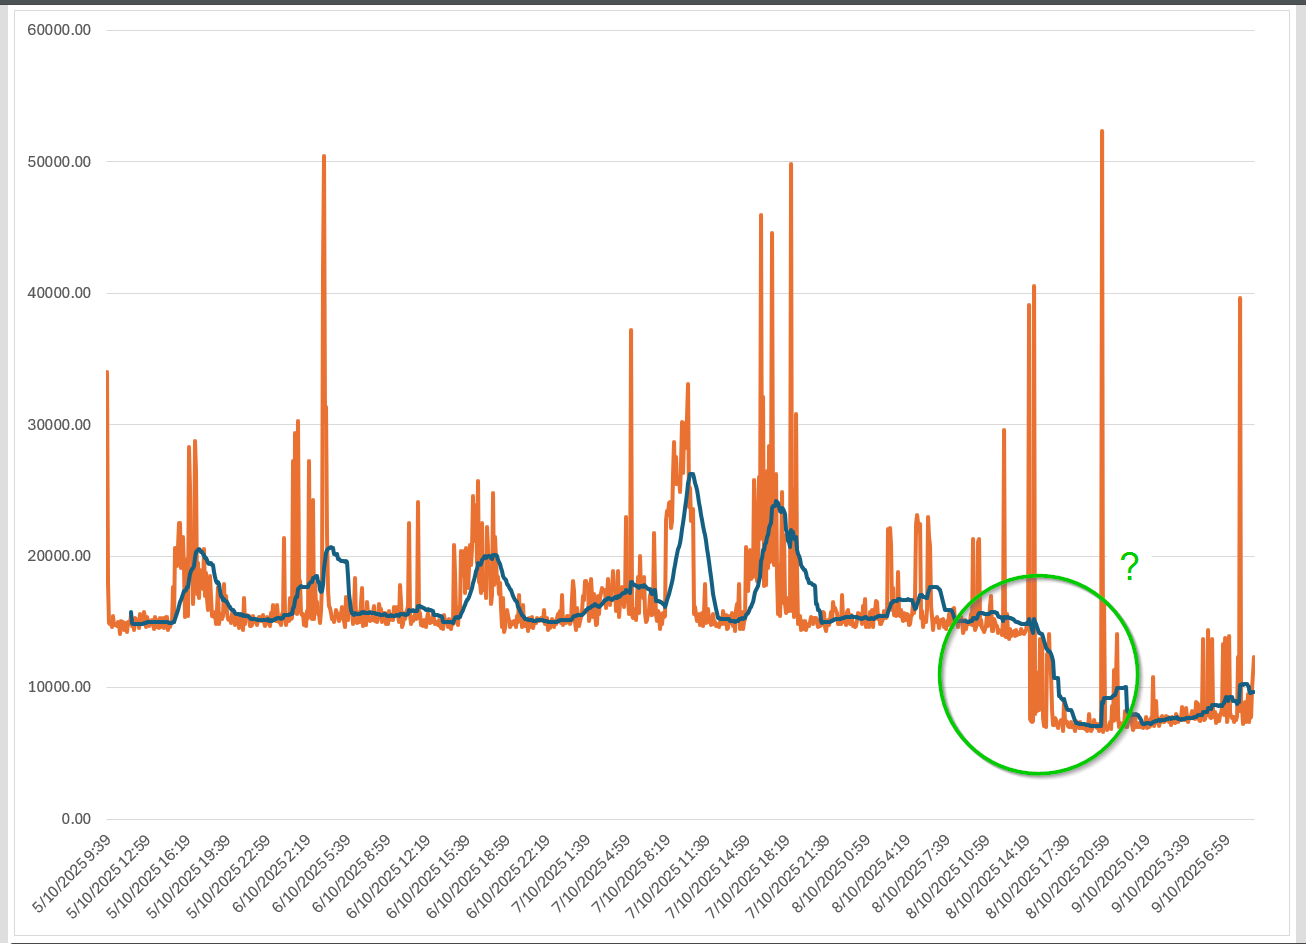
This is kind of what I was alluding to @aosemwengie1. If we all did this, we could have a better picture for them and perhaps spark some action because it’s based on facts.
I beg to differ customers pay for a service it is not called SaaS for nothing.
There are sophisticated tools for monitoring that can capture all aspects of running app servers and sql server. That level of observability should provide Epicor more than enough information for proactive monitoring and isolate customers from anything than the most severe outages/issues.
Support’s response was to ignore all the detailed info I provided, including detailed server logs and time stamps, and ask again,
Is the customer experiencing slowness continuously, or does it occur only during specific times?
So that was pointless.
None of this is settling. I created a case today. So… Epicor’s response to you was ‘just ask later’?