fuji36
May 31, 2024, 12:00pm
1
We are on Kinetics 2022.1.3
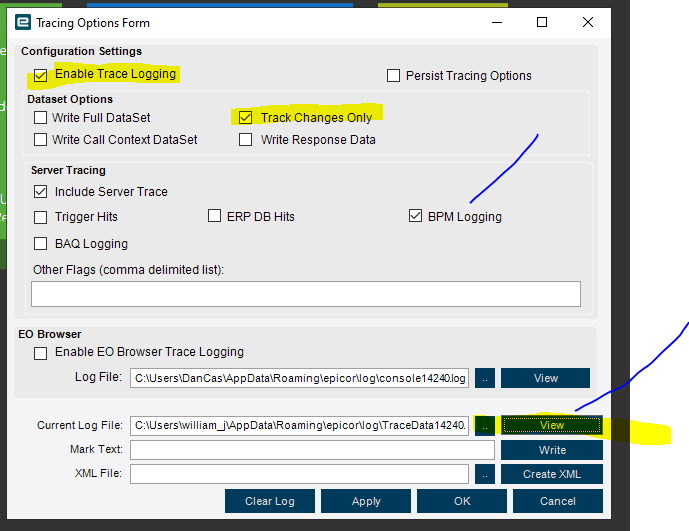
I know that previously, when we ran a trace from the Trace Options Form and selected ‘BPM Logging’ we could see which BPM’s ran, how long they took, etc.
It seems that is no longer the case, we select it, but the BPM info is no longer part of the trace.
mbayley
May 31, 2024, 2:26pm
2
Are you attempting to trace a Classic App or the New Browser UX?
2 Likes
fuji36
May 31, 2024, 2:29pm
3
Classic App, for this particular screen/form we are running only Classic app/screen.
mbayley
May 31, 2024, 2:35pm
4
Sorry, not familiar. I usually open the server logs for BPM Logs.
1 Like
fuji36
May 31, 2024, 4:50pm
5
Hey Michael, thank you.
I am not familiar with opening the server logs for that info.
If you have a minute, can you screen shot and explain how that is done? I have always done it thru Client Trace form.
mbayley
May 31, 2024, 5:02pm
6
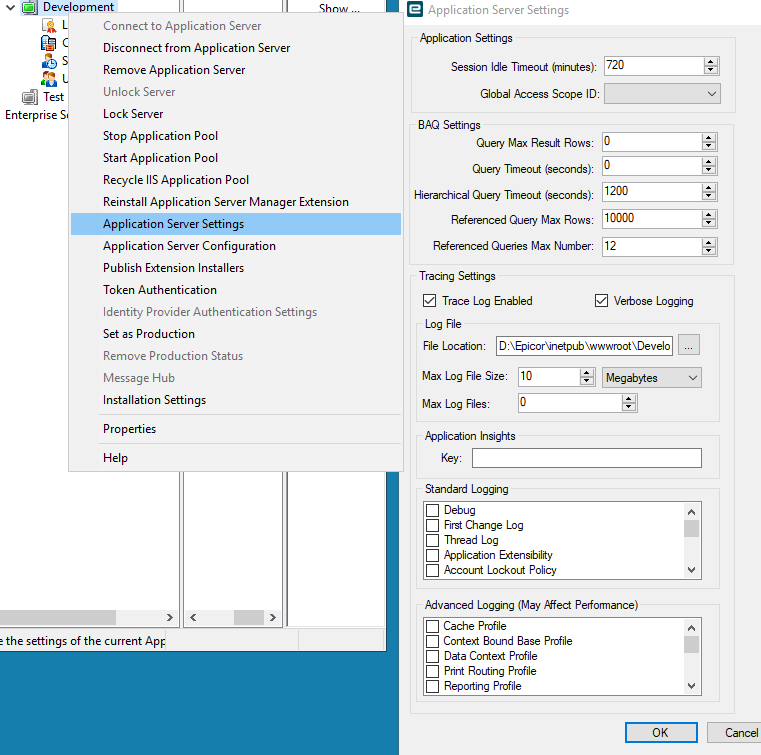
BPMs are run on the server, so it’s always made sense for me to look for them there.
You will have to enable tracing on the server, this is what ours looks like in Development.
Under Standard Logging, we have the BPM, BAQ, and Host Logging enabled.
Here’s what a log may look like
1 Like
fuji36
May 31, 2024, 5:15pm
7
Thank you Mbayley, I appreciate the help
1 Like