Hey guys! I’m trying to see if there’s a slick way to take a single data row that has 12 columns and display it with each column name as a new row with the data row listed as a column to the right. It’s essentially the equivalent of Excel transpose function. Any suggestions?
I believe you can do this with a BAQ Pivot (though its mostly hard coded ish for each column) say each month of the year.
Oddly enough, I’m not doing months. But I assume the concept is the same? BAQ Pivot is my search terms?
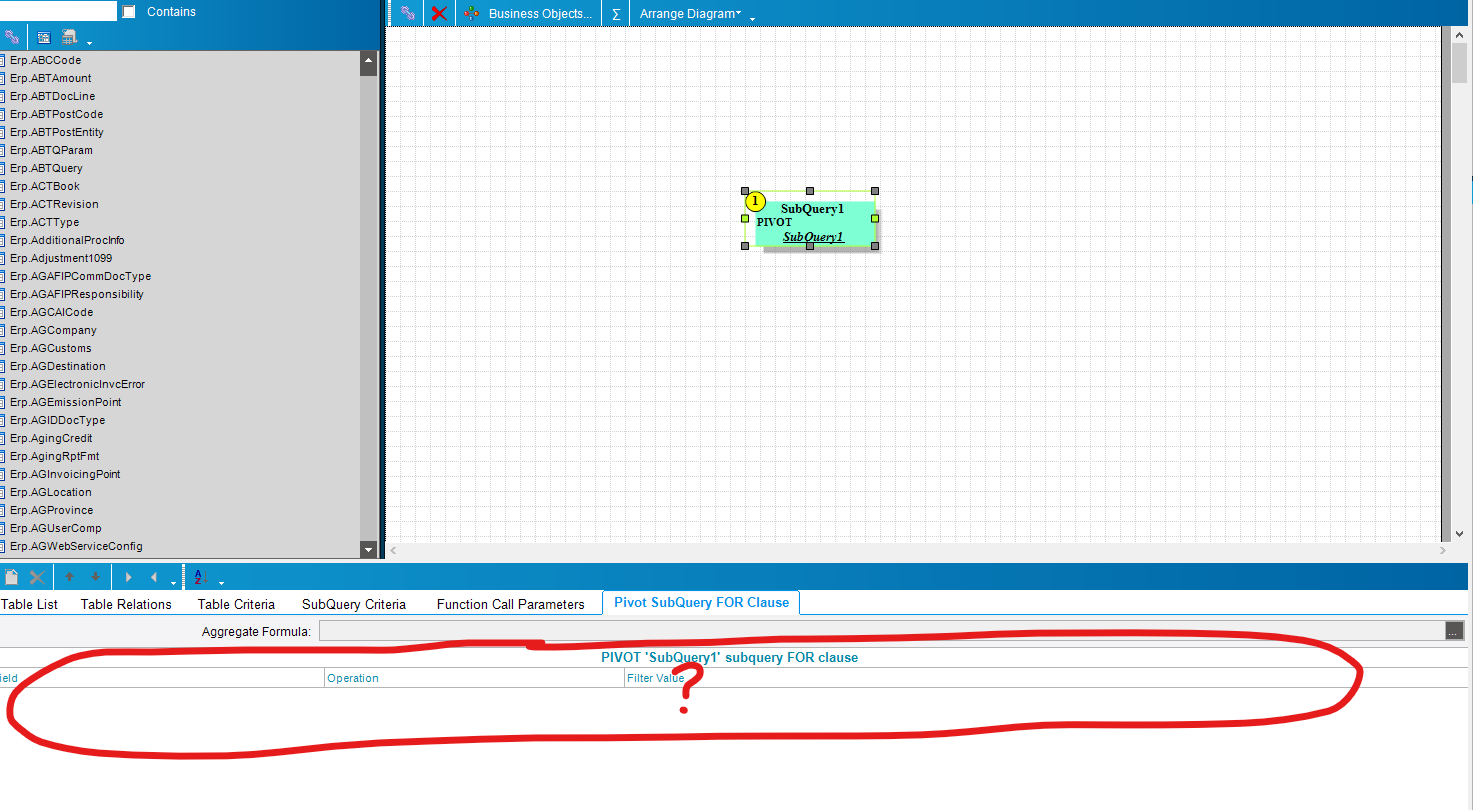
BAQ Pivot in a BAQ yes.
I guess I do’nt understand the referenced dashboard to know what you are trying to do.
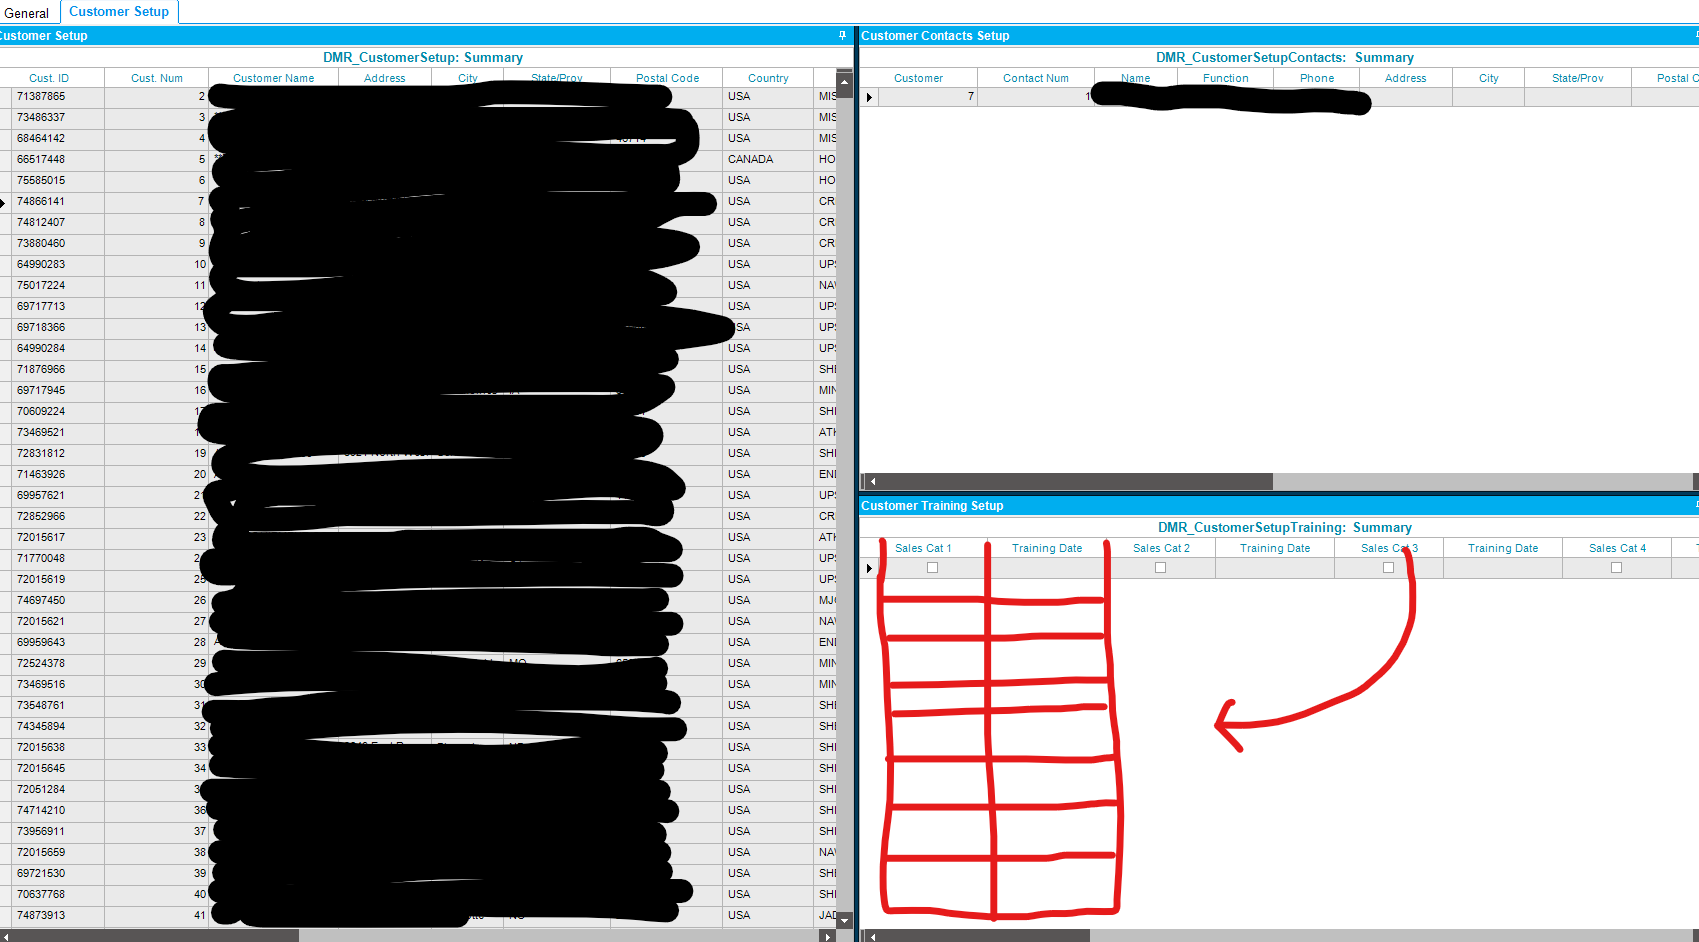
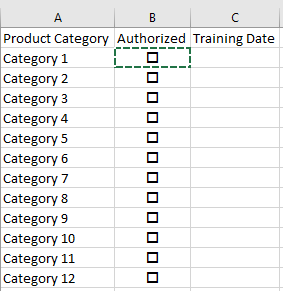
I have 12 different types of training that we offer. The training table is a UD table linked to the customer table with CustNum. I made the Training table subscribe to the Customer table in the dashboard so I should only ever retrieve one row of data with the training information for that one customer. I want it to look something like this…
Did you ever figure it out?
You could do this in code by unrolling it in the GetList and rolling it back up in the Update.
It would be really neat to find out there was a way to do it automagically though.
In the new BAQ Designer there is now UNPIVOT in addition to PIVOT.
What I thought of when you said “UnPivot”
