Hi,
I am trying to change some standard reports into dashboards, or NICE Excel spreadsheets. In particular, at this time, I want to get excel version of the BOM Cost Report. I try to export to excel but it is quite messy, blank columns, rows, merged cells… I tried creating a new report style and using SSRS but this is tedious and hasn’t quite worked – close but still messing up.
Is there a way I can convert or use this report as a dashboard?
If you’re exporting to Excel, you could use VBA to format them. Then just call it each time you run the report. I did that for our Part Sales Analysis report about 4 years ago. It takes time initially and is hella tedious, but once it’s good, you can use it forever unless your report style changes. You can always create dashboards too, and that is probably easier, though I don’t recall how many of those report fields are external, and those can (sometimes) be harder for me to duplicate. I’m sure you’ll get much better advice from the more experienced peeps, but I just wanted to mention that I have used VBA for this successfully in the past. Hope that helps.
I thought of VBA, currently I am doing it via formulas right now. Basically loading the Excel report into 1 sheet and then using a separate sheet with formulas to format it nicely.
Hella tedious as you say, but do once and it can be re-used.
You can use the excel data only option, then edit the rdl file to format to your liking.
You will see the new rdl after previewing the the report using Excel or Excel data only.
After you edit the rdl, it is used anytime you preview to excel again.
Above you see many good ideas.
My preference though is to create my own SSRS template on SSRS side and create a report Style inside Epicor and link the new report style to the custom SSRS report.
Why do I like this? Well here is the thing…
Sometimes Epicor does not offer all the info that you need in the format that you want. For instance we needed to replicate a manual process where our operation team via which tracked each department’s progress. This is a custom report and not possible to be done in Epicor. You could use a BAQ report for it but still you cannot have an SSRS format where you get section by Section data (not talking about page break after each group) and custom aggregations accompanied with all sorts of filters and tables…
It worked for us very well.
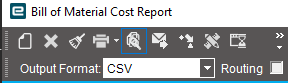
When you export the report as CSV, you get all kinds of weird labels as column headers and lots of fields that you do not need.
When you export the Excel Data, there is always a chance of weird formatting issues after export and the tabular data might break and come out corrupted with out of place new lines and many other issues.
What is the downside of what I did then? Well experts can add to what I mention below but here are a few things I experienced:
1- Your SSRS report relies on the data set that you define for it, so if you update your data definition inside Epicor, your SSRS might stop working and since it is custom, you cannot synchronize and fix it, manual maintenance in a gist.
2- When moving to a new system or copy/restore your database on another environment (for instance Test/Pilot,…) you have to manually upload these reports to the SSRS server location and make sure credentials work if you added any new data source within the report itself.
3- I think the most important one is that there will be no way to verify the output with what you see inside Epicor if you create a custom SSRS…
I think regardless of the downside in a general conversation, in your case you won’t be impacted by any of these, so if I were in your shoes I would copy the report style on SSRS, modify it the way that I wanted, and link it to a new report style.
Regarding conversion to a dashboard, it has proven very hard to do so in some cases, a good example of it the stock status report. So unless you know the exact query behind the scenes it is impossible to replicate it as a dashboard.
I did create a new report style – just never though of exporting to CSV – that looks much better – I can takes care of the many weird labels through vba a or pivot tables.