Not directed to anyone in particular, but this came across my Twitter feed the other day… Happy Friday!

1 Like
Must be Friday…
So gonna dispel a few urban myths:
- ERP stands for Enterprise Resource Plannning. Nope, it stands for Excel Replacement Project
maybe a bit further out there:
-
PCMCIA - Personal Computer Memory Card International Association. Nope, People Can’t Memorise Computer Industry Accronyms
-
ISDN - Integrated Services Sigital Network. Nope I Still Dont know
6 Likes
The Olds like me get this but not sure about the youngsters in the group! ![]()
They’re all googling those right now…
I had always learned:
ISDN - It Still Does Nothing
1 Like
128K was amazingly fast compared to analog modems! ![]()
But the improvement was nothing like the cable modem!
Ahhh… the good 'ol days when AT&T ruled the telecom world… to then get completely blindsided by MCI and then the cable TV industry.
But without Bell Labs we would probably not be here now.
1 Like
Literally since the site is probably hosted on Linux or BSD!
1 Like
Yea, Microsoft makes better tools now… like Power BI
Honestly though, if you haven’t replicated MRP using VBA scripts in excel then you have never used an AS400.
2 Likes
![]()
oh yeah!
Although I didn’t do it on an AS400, just a windows XP box and an enormous spreadsheet we called the Giraffe, because it was clumsy-looking, way bigger up close than you expected, and remarkably graceful when it managed to run.
We had a tech manually entering up to 200 order lines a day into this, using VBA to parse the (Excel) BOMs, update (Excel) inventory, check (Excel) mins and spit out an (Excel) report on PO Suggestions.
It worked, for our volume at the time, as well as (cough, cough) anything we’ve used since, although it didn’t scale very well whereas other things (cough, cough) hopefully will…
I never used an AS400, but I have used an HP3000 which is Hewlett-Packard’s version of the same. The reason that mini-computers got popular was that it was difficult to program mainframes. The reason Excel got popular was that eventually mini-computers were not changing fast enough too. Like Excel, mini-computers brought the problem of sprawl and multiple versions of the truth.
With the security context we live in now, having portable data with scripting access to its host computer is a total nightmare. ![]()
At its core, Excel is a single user application - much like the original mainframes. And so the world cycles around with a “mainframe application” (PowerBI) running on a “mainframe” (the cloud). The more the world changes…
![]()
If you don’t like Excel then be prepared to have your mind blown.
Here is the live stream from the last competition. Excel Esports: ALL-STAR BATTLE - YouTube
1 Like
That’s awesome hahaha!
Oh, I like Excel. It helps me explain to users why we should put data in Epicor into fields instead of comments.
I say, “Here’s all the data you requested. It’s all in column A. Just parse it out with VBA, the world’s finest malware downloader.”
![]()
2 Likes
@Mark_Wonsil just for you.
I did this when I was dying of boredom one day during the lockdown
There’s probably better, simpler etc. ways even in Excel but it was fun for a beginner. It also helped me figure out stuff I was trying to do in C# in BPMs.
Public Function AA_GetToken()

    Set objReq = CreateObject("MSXML2.XMLHTTP")
    strUrl = "https://thing.mydomain.com/myAppServer/TokenResource.svc"
    boolAsync = True


    With objReq
        .Open "POST", strUrl, boolAsync
        .setRequestHeader "Content-Type", "application/json"
        .setRequestHeader "username", "myDevUser"
        .setRequestHeader "password", "myDevPassword"
        .send
        While objReq.readyState <> 4
            DoEvents
        Wend
        strResponse = .responseText
    End With

    intStart = InStr(1, strResponse, "AccessToken", vbTextCompare) + 12
    intLen = InStr(1, strResponse, "/AccessToken", vbTextCompare) - intStart - 1

    AA_GetToken = Mid(strResponse, intStart, intLen)

End Function
and then
Public Function AB_GetCustomer(custNum As Integer, strAPIKey As String)

    Dim onjReq As Object
    Dim jsonObj As Object
    Dim strCust As String
    Dim objReq As Object


    Set objReq = CreateObject("MSXML2.XMLHTTP")
    strUrl = "https://thing.mydomain.com/myAppServer/api/v2/odata/CompanyCode/Erp.BO.CustomerSvc/Customers?$filter=CustNum%20eq%20" + Trim(Str(custNum))


    strToken = "Bearer " + AA_GetToken
    boolAsync = False

    With objReq
        .Open "GET", strUrl, boolAsync
        .setRequestHeader "Authorization", strToken
        .setRequestHeader "Content-Type", "application/json"
        .setRequestHeader "Accept", "application/json"
        .setRequestHeader "x-api-key", strAPIKey
        .setRequestHeader "Host", "thing.mydomain.com"
        .setRequestHeader "Connection", "keep-alive"
        .send
        While objReq.readyState <> 4
            DoEvents
        Wend
    End With

    strCust = objReq.responseText


    Set dic = ParseJSON(strCust)


End Function
And finally for the ParseJSON function I finally gave up and borrowed from this:
I’ll probably never do anything with it except print in colour for my study wall when I have grandchildren but even that’s useful…
1 Like
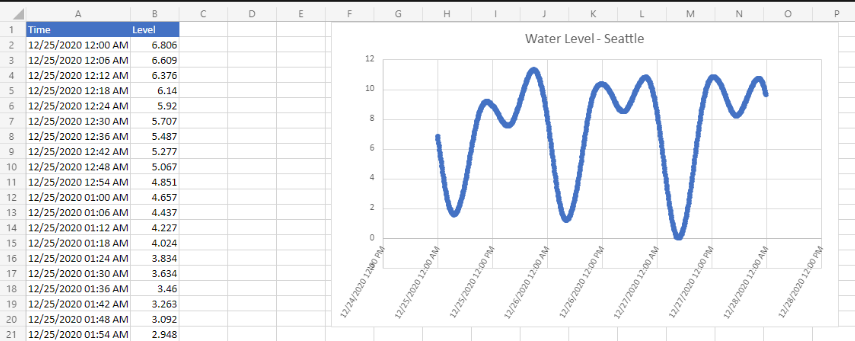
Like I said, I like Excel. I don’t care for VBA much though…so here’s an Office Script example that also downloads REST data into Excel. The nice thing about TypeScript/JavaScript in Excel is that it runs in a sandbox and cannot interact with your hardware directly. Also, it runs online and on your phone/tablet.
From: Office Scripts sample scenario: Graph water-level data from NOAA
/**
 * Gets data from the National Oceanic and Atmospheric Administration's Tides and Currents database.
 * That data is used to make a chart.
 */
async function main(workbook: ExcelScript.Workbook) {
  // Get the current sheet.
  let currentSheet = workbook.getActiveWorksheet();

  // Create selection of parameters for the fetch URL.
  // More information on the NOAA APIs is found here:
  // https://api.tidesandcurrents.noaa.gov/api/prod/
  const option = "water_level";
  const startDate = "20201225"; /* yyyymmdd date format */
  const endDate = "20201227";
  const station = "9447130"; /* Seattle */

  // Construct the URL for the fetch call.
  const strQuery = `https://api.tidesandcurrents.noaa.gov/api/prod/datagetter?product=${option}&begin_date=${startDate}&end_date=${endDate}&datum=MLLW&station=${station}&units=english&time_zone=gmt&application=NOS.COOPS.TAC.WL&format=json`;

  console.log(strQuery);

  // Resolve the Promises returned by the fetch operation.
  const response = await fetch(strQuery);
  const rawJson: string = await response.json();

  // Translate the raw JSON into a usable state.
  const stringifiedJson = JSON.stringify(rawJson);

  // Note that we're only taking the data part of the JSON and excluding the metadata.
  const noaaData: NOAAData[] = JSON.parse(stringifiedJson).data;

  // Create table headers and format them to stand out.
  let headers = [["Time", "Level"]];
  let headerRange = currentSheet.getRange("A1:B1");
  headerRange.setValues(headers);
  headerRange.getFormat().getFill().setColor("#4472C4");
  headerRange.getFormat().getFont().setColor("white");

  // Insert all the data in rows from JSON.
  let noaaDataCount = noaaData.length;
  let dataToEnter = [[], []]
  for (let i = 0; i < noaaDataCount; i++) {
    let currentDataPiece = noaaData[i];
    dataToEnter[i] = [currentDataPiece.t, currentDataPiece.v];
  }

  let dataRange = currentSheet.getRange("A2:B" + String(noaaDataCount + 1)); /* +1 to account for the title row */
  dataRange.setValues(dataToEnter);

  // Format the "Time" column for timestamps.
  dataRange.getColumn(0).setNumberFormatLocal("[$-en-US]mm/dd/yyyy hh:mm AM/PM;@");

  // Create and format a chart with the level data.
  let chart = currentSheet.addChart(ExcelScript.ChartType.xyscatterSmooth, dataRange);
  chart.getTitle().setText("Water Level - Seattle");
  chart.setTop(0);
  chart.setLeft(300);
  chart.setWidth(500);
  chart.setHeight(300);
  chart.getAxes().getValueAxis().setShowDisplayUnitLabel(false);
  chart.getAxes().getCategoryAxis().setTextOrientation(60);
  chart.getLegend().setVisible(false);

  // Add a comment with the data attribution.
  currentSheet.addComment(
    "A1",
    `This data was taken from the National Oceanic and Atmospheric Administration's Tides and Currents database on ${new Date(Date.now())}.`
  );

  /**
   * An interface to wrap the parts of the JSON we need.
   * These properties must match the names used in the JSON.
   */
  interface NOAAData {
    t: string; // Time
    v: number; // Level
  }
}
2 Likes
mark this is how I give a quick understanding of the cloud to folks also. Back to the 50/60 computing process.
“Running on a “mainframe” (the cloud)”
2 Likes