How do you trace the kinetic MES?
1 Like
As far as I know you can’t trace Kinetic. You have to use a browser and sniff around in the dev menu (F12). I think all the methods are exposed in there somewhere. Perhaps someone else can help us understand the best way to use dev tools for tracing.
1 Like
I opened a case with support. Their documentation says you can do a server trace but it is not very clear between the client and browser. So who knows.
If using the desktop client, you can turn on debug by adding this line to your sysconfig file:
<LaunchEOBrowserDebug value="true" />
EO is the browser Kinetic uses in the desktop client.
In the browser, you can do F12 then Crtl+Alt+8 to turn on debugging.
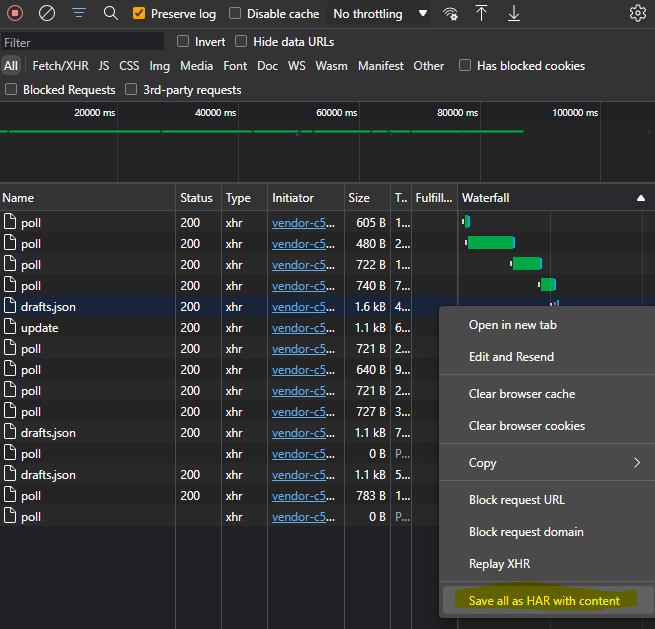
You’ll want to look at the Console tab and the Network tab. The network tab will show all the calls to the server, which is essentially the trace. It does not write to a file but you can do that in the browser: To record events, press the record button and check the Preserve Log check box. Right mouse click in the Network Pane and select Save all as HAR with content. (HAR = http archive)
The format is different than the XML. There are HAR viewers available around the interwebs.
3 Likes
Does it also give the return calls from the server?
I don’t think so John. Server tracing probably works with a WebConfig change, but being Mr. Cloud, I usually lived without it. ![]()
Thanks! As I am turning into MR. Cloud soon I need to learn all the tricks!
1 Like