MRP Trouble

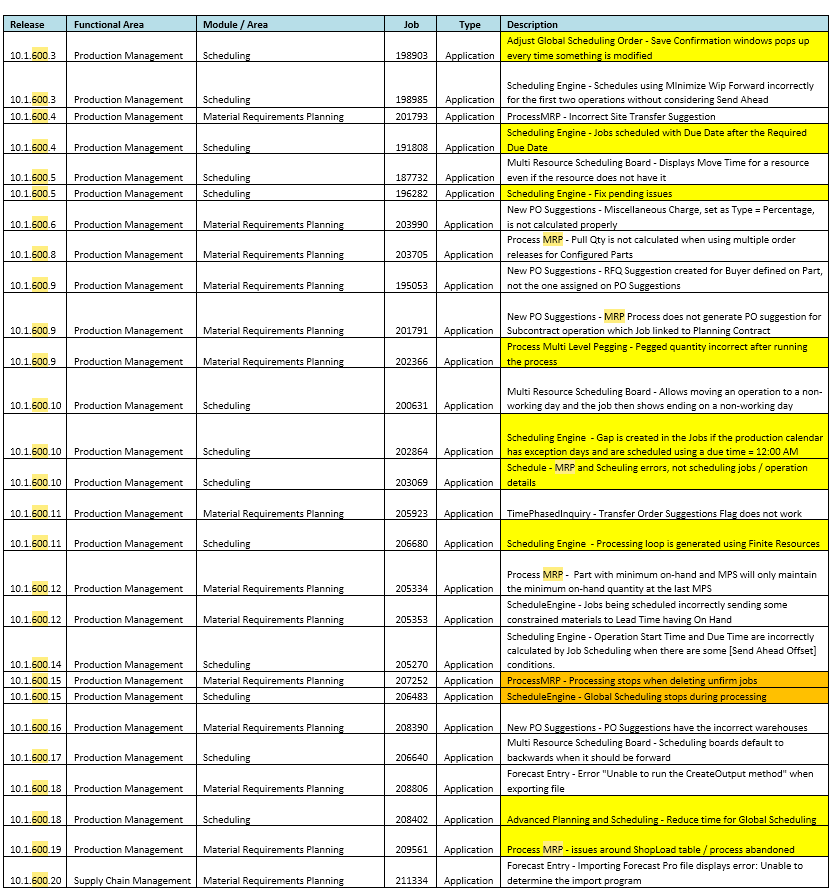
We are on Epicor 10.1.500.14 and in the last few weeks we’ve really been struggling with MRP. It’s gotten to the point where I log in every night, late in the evening to check on it, and folks here who depend on MRP are getting quite frustrated. And my old tricks (reboot all server (app and SQL database) force MRPRecalcNeeded = true on all parts and run net change, etc.) are not helping this time.

In an nutshell: if we try to run a Full Regeneration, more and more frequently it will bomb out on trying to delete the unfirm jobs:

23:45:04 ------------------------------------------------------------
23:45:04 Beginning of Delete Unfirm Jobs
00:45:05 Execution Timeout Expired.  The timeout period elapsed prior to completion of the operation or the server is not responding.
The statement has been terminated.
00:45:05 The wait operation timed out
00:45:04 Execution Timeout Expired.  The timeout period elapsed prior to completion of the operation or the server is not responding.
The statement has been terminated.
00:45:04    at System.Data.SqlClient.SqlConnection.OnError(SqlException exception, Boolean breakConnection, Action`1 wrapCloseInAction)
   at System.Data.SqlClient.TdsParser.ThrowExceptionAndWarning(TdsParserStateObject stateObj, Boolean callerHasConnectionLock, Boolean asyncClose)
   at System.Data.SqlClient.TdsParser.TryRun(RunBehavior runBehavior, SqlCommand cmdHandler, SqlDataReader dataStream, BulkCopySimpleResultSet bulkCopyHandler, TdsParserStateObject stateObj, Boolean& dataReady)
   at System.Data.SqlClient.SqlCommand.FinishExecuteReader(SqlDataReader ds, RunBehavior runBehavior, String resetOptionsString, Boolean isInternal, Boolean forDescribeParameterEncryption, Boolean shouldCacheForAlwaysEncrypted)
   at System.Data.SqlClient.SqlCommand.RunExecuteReaderTds(CommandBehavior cmdBehavior, RunBehavior runBehavior, Boolean returnStream, Boolean async, Int32 timeout, Task& task, Boolean asyncWrite, Boolean inRetry, SqlDataReader ds, Boolean describeParameterEncryptionRequest)
   at System.Data.SqlClient.SqlCommand.RunExecuteReader(CommandBehavior cmdBehavior, RunBehavior runBehavior, Boolean returnStream, String method, TaskCompletionSource`1 completion, Int32 timeout, Task& task, Boolean& usedCache, Boolean asyncWrite, Boolean inRetry)
   at System.Data.SqlClient.SqlCommand.InternalExecuteNonQuery(TaskCompletionSource`1 completion, String methodName, Boolean sendToPipe, Int32 timeout, Boolean& usedCache, Boolean asyncWrite, Boolean inRetry)
   at System.Data.SqlClient.SqlCommand.ExecuteNonQuery()
   at Erp.Internal.MR.MrpExp.deleteUnfirmJob(String vPlantList) in C:\_Releases\ERP\UD10.1.500.14\Source\Server\Internal\MR\MrpExp\MrpExp.cs:line 1966
   at Erp.Internal.MR.MrpExp.main_block(List`1 ttMrpProcRows, List`1 ttMrpQueueRows) in C:\_Releases\ERP\UD10.1.500.14\Source\Server\Internal\MR\MrpExp\MrpExp.cs:line 2597
   at Erp.Internal.MR.MrpExp.RunProcess(Int64 instanceTaskNum, String outputFileName) in C:\_Releases\ERP\UD10.1.500.14\Source\Server\Internal\MR\MrpExp\MrpExp.cs:line 945
00:45:04 The wait operation timed out
00:45:04 Unexpected Error - Cancelling MRP - MrpExp
00:45:07 Cancelling from MrpExp stopProcesses

Some sort of 60 minute timeout? But what would introduce this, we haven’t changed configuration of timeouts since going live on Epicor 10.1.500 almost 2 years ago now. And now this is happening like 50-80% of the time, but occasionally it will actually run okay, and often times the delete unfirm jobs step is actually more than an hour long and it works anyhow!? So, in an attempt to get around this, I’ll try running a Net Change MRP instead. Sometimes I can get this to go, but it is tough because I have to run it with a TON of processes or force some parts to NOT process MRP, because you see a bunch of this happening in the log file:

10:33:58 ------------------------------------------------------------
10:33:58 Starting sub-processes
10:33:58 Scheduling Jobs...
10:33:59 Building Non-Part List
10:34:09 Building PartList Level: 0-0
10:35:40 Process 4 not responding.  Abandoned during process 'Defunct : Processing Part~4447601'
10:38:41 Process 1 not responding.  Abandoned during process 'Defunct : Processing Part~4468012'
10:38:41 Process 2 not responding.  Abandoned during process 'Defunct : Processing Part~4048401-40R'
10:38:41 Process 3 not responding.  Abandoned during process 'Defunct : Processing Part~4448401'

The hardware hasn’t changed in at least a year as well, other than the virtual machines getting a little notch up in vCPU / RAM count awhile back to try to increase performance a bit. And this is not lame hardware - we’re talking Intel P3700 NVMe SSD for storage, etc.

Here are the full main log files in case the run parameters might be important:

MRP_NetAfterReboot_.log.txt (24.5 KB)

One of the processes that choked right away (two runs in here): MRP_NetAfterReboot_004.log.txt (32.4 KB)

MRP_Friday_.log.txt (13.5 KB)

First you should upgrade to 10.1.500.3x - there were several fixes prior to .31 fixing MRP Stuff.
Second, do you have ANY _UD Fields on JobProd, JobMtl, JobAsmbl ?

Boy - I’ve been asked by management to patch to 10.1.500.3x actually, but I’m trying to talk them out of it. We’re already considering upgrading to 10.2.xxx next year, and I just haven’t had anyone yet convince me that we could upgrade Epicor, even if it is just a patch, without doing a full-blown, month(s) long set of conference room pilots, eating up lots of everyone’s time testing the patched Epicor in a virtual environment. If only Epicor made the patches true non-schema changing, so that you could “unapply” them or rollback to previous patch release if something went terribly wrong.

As far as the _UD fields on those tables, I would have guess no but I actually went and looked and sure enough there is one UD column on JobMtl

Looks like this is the only Job related table that has any UD columns.
image

That is your problem. I am certain if you look at your SQLDATA Folder under Logs you should see a ERRORLOG which probably hints at JobMtl_UD deadlocking.

Epicor has some issues with how _UD tables are indexed. Setting your fillfactor on JobMtl_UD to 40% from default 100% should do the trick.

ALTER INDEX PK_JOBMTL_UD ON erp.JobMtl_UD
REBUILD WITH (FILLFACTOR = 4, ONLINE = ON);
GO

Might have to take your index offline, can’t remember how if your on Standard.


We have had several issues and each one had a unique fix:

  1. Using _UD Columns on JobAsmbl, JobMtl caused deadlocks due to the SQL FillFactor 0 or 100 once we modified the JobAsmbl_UD and JobMtl_UD Fillfactor to 50 to be in alignment with JobAsmbl and JobMtl, it solved those deadlocks. BIGGEST ISSUE
  2. Having 1 Sales Order with 1 Release but a Qty 50 or greater and then having Min/Max Qty on the Part set to create a new Job Per Quantity (basically 1.00) caused deadlocks. We had to create alot releases, looks like MRP doesnt play nice with Min/Max, multiple orders, large quantities.
  3. We had to cleanup Jobs with like No Related Ops and incorrect dates.
  4. Doing a VMWare Snapshot during MRP Run seemed sometimes to cause deadlocks so we moved our Snapshot times

Some of yours look similar to ours when we had bad data. We worked closely with developers from Epicor to narrow things down. But that above was usually the gist of it.

We Run MRP with: 8 Schedulers and 8 Processors and were able to replicate issues on VMWare and Physical Server (to narrow out the Network).

10.1.500.31 - they fixed alot of issues on MRP in the early 500’s. So Upgrade if you can its a minor upgrade .15 to .31+ should be straight forward… 30 minute tops.

similar fixes in 500.15 >

4 Likes

We went from 10.500.18 to 10.500.31 without a problem. Actually MICR was the only thing causing some issues. If you have MICR, I can give you a patch… other than that; it was minor upgrade, no issues. We have 13 Multi-Company processes, Inter-Company, etc… all was good.

1 Like

Haso - so I ran your script yesterday and MRP ran fine last night. Of course, it had to run fine the night before too (prior to setting the fill factor) just because it hates me and wants me to question whether this is going to work or not. Maybe it just like it when I check in several times every night to see how it’s doing. It’s lonely. :wink:

I did some reading up on fill factor this morning and I have a question: is it possible there is a typo in your script above - namely, you said 40% but then the script looks to me like it is setting it to only 4%?

PS - Some of the articles I’m reading:

1 Like

Maybe my fill_factor is set to 4% and not 40% which I assumed because 0 = 100%. Nevertheless = 5 solved my issue but the goal was to match my page count to be as close as possible to JobAsmbl. Perhaps I don’t need to go that low, because in another Thread Raj Tapde from Epicor said I can set it to = 20.

Close Enough Good for JobAsmbl - but JobMtl caused Deadlocks when I had it this way:

So try 40 and not 4% =) and then work your way down… Its all because of the way the _UD index works.

Queries I use to Validate:

SELECT fill_factor, * FROM sys.indexes where name in ('PK_JobAsmbl_UD', 'PK_JobMtl_UD');
 
SELECT dbschemas.[name] as 'Schema', 
dbtables.[name] as 'Table', 
dbindexes.[name] as 'Index',
indexstats.alloc_unit_type_desc,
indexstats.avg_fragmentation_in_percent,
indexstats.page_count
FROM sys.dm_db_index_physical_stats (DB_ID(), NULL, NULL, NULL, NULL) AS indexstats
INNER JOIN sys.tables dbtables on dbtables.[object_id] = indexstats.[object_id]
INNER JOIN sys.schemas dbschemas on dbtables.[schema_id] = dbschemas.[schema_id]
INNER JOIN sys.indexes AS dbindexes ON dbindexes.[object_id] = indexstats.[object_id]
AND indexstats.index_id = dbindexes.index_id
WHERE indexstats.database_id = DB_ID() AND dbindexes.[name] LIKE 'PK_JobMtl%' OR dbindexes.[name] LIKE 'PK_JobAsmbl%'
ORDER BY indexstats.avg_fragmentation_in_percent desc

Also for those wondering if this could all be only related to latency on hardware, it’s not. We moved it from VMWare even to a Physical Host and I can replicate the issue on any database when creating JobMtl_UD or JobAsmbl_UD columns and full regening database, even on SSD Drives.

If you have a test environment set it back to 0 or 100 and re-run MRP eventually within 1 or 2 attempts you will get it to crash. Then set it back to 5 or 40 or 20 and run MRP Full Regen multiple times, should be good then :slight_smile:

So, I did FillFactor = 40 and here are my fragmentation / page count results now:

Apparently we have a lot more rows in these tables than the database you are showing above?

Shouldn’t we also be concerned about the other indexes (primary keys) having such a super high fragmentation? I guess there is a difference in that the other primary keys in Epicor seem to be (Unique, Non-Clustered) and these _UD tables are (Clustered)
image

Guess I might still need to do some more reading.

Well I am able to knock my fragmentation down to 10% but as soon as I run MRP it goes back up to 99%. I think it has to do with the way Epicor has Index Keys set… I pinged @Edge once on twitter about it and he agrees that there is room for improvement. Hopefully Epicor keeps optimizing their indexes.

Over the weekend the evil MRP crashing after an hour of trying to “delete unfirm jobs” returned with no solution in sight. So I spoke with my cousin who knows a thing or two about SQL databases as well, and he reminded me of the awesome power of being able to look at the currently running queries using a sproc like sp_WhoIsActive2 or my-favorite-query.

So I kicked off MRP Full Regen, let it get to the Deleting Unfirm Jobs step, waited a few minutes, and then ran sp_WhoIsActive2 - and there was the culprit, a query that appears to be clearing Transfer Order suggestions and had been running for over 5 minutes already:

delete a 
from Erp.TFOrdDtl a inner join Erp.PartDtl c on a.Company = c.Company and a.TFLineNum = c.TFLineNum 
inner join Erp.JobHead b on c.Company = b.Company and c.JobNum = b.JobNum where b.Company = 'LEER' 
        and b.JobClosed = 0 and b.JobFirm = 0

Now I’m having deja vu. I turn this into a SELECT * statement instead of a delete and run it, but I have already guessed how many results there are going to be. Sure enough: zero. But even the select query takes several minutes to run. So I have SQL Query Analyzer show me the execution plan, and there is a table scan and a proposed missing index. I’m in kind of a hurry to get MRP working, so I took the proposed index as is - it might potentially be optimized more or have fewer included columns?

/*
Missing Index Details from SQLQuery3.sql
The Query Processor estimates that implementing the following index could improve the query cost by 61.1133%.
*/

USE [Epicor]
GO
CREATE NONCLUSTERED INDEX LEER_IX_PartDtl_JobNum
ON [Erp].[PartDtl] ([Company],[JobNum])
INCLUDE ([Type],[PartNum],[DueDate],[RequirementFlag],[Quantity],[AssemblySeq],[JobSeq],[OrderNum],[OrderLine],[OrderRelNum],[PONum],[POLine],[PORelNum],[PartDescription],[IUM],[SourceFile],[CustNum],[StockTrans],[FirmRelease],[RevisionNum],[TargetOrderNum],[TargetOrderLine],[TargetOrderRelNum],[TargetWarehouseCode],[TargetJobNum],[TargetAssemblySeq],[TargetMtlSeq],[Plant],[InvLinkNum],[PlantTranNum],[TFOrdLine],[TFOrdNum],[TFLineNum],[SourceDBRecid],[NonPart],[BOMChanged],[BaseQty],[BaseQtyUOM],[InvtyQty],[InvtyQtyUOM],[JobFirm],[PartDtlSeq],[SysRevID],[SysRowID],[ContractID])
GO

Now I can run the select statement and it takes only 10-20 seconds (and still returns zero results). The delete statement takes 2 to 3 minutes, but this is a big improvement over running for an hour and then timing out, killing MRP!

2 Likes

And now MRP is running in about an hour, or 1.5 hours, instead of 3-5 hours!

Just wanted to add that we had similar issues and @hkeric.wci’s MICR patch was a life saver!

Can you show me how you did the whoisactive to show the culprit query? I have the feeling we have similar issues. MRP net changes run fine for us but MRP full regen in 3 different companies at 3 different times seems to be crashing. We copy our DB over to different Epicor servers and it runs fine. Currently working with Epicor and we are having trouble finding the solution on this one. we are getting this in MRP runs when it crashes:

An error occurred trying to run a sub-task:

System.TimeoutException: This request operation sent to net.tcp://[servername]/EpicorERP/Ice/Lib/RunTask.svc did not receive a reply within the configured timeout (00:05:00). The time allotted to this operation may have been a portion of a longer timeout. This may be because the service is still processing the operation or because the service was unable to send a reply message. Please consider increasing the operation timeout (by casting the channel/proxy to IContextChannel and setting the OperationTimeout property) and ensure that the service is able to connect to the client.

We’re on 10.2.300.40

I’m sorry if this topic has been dead for awhile but we recently started encountering a problem running full regen when it gets to deleting records from TFOrdDtl. As mentioned above, it hangs on deletions from that table and then finally errors out. I saw the proposed solution above and it involves creating an index for Erp.PartDtl.

The problem is a Non-Unique, Non-Clustered index already exists called ‘IX_PartDtl_JobNum’, but it only contains the following fields:

[Company] ASC,
[JobNum] ASC,
[AssemblySeq] ASC,
[Type] ASC,
[JobSeq] ASC

Besides, I didn’t think Epicor wanted customers redefining their indexes.

I can understand Epicor not wanting you to redefine indexes they have created, however, I have found significant performance gains by analysing the Epicor database and a creating your own additional indexes.

The key thing is to use a common naming convention, so you can easily identify the ones you have created.

1 Like

Be sure to keep them all stored in a common folder or something too - when you upgrade Epicor significantly (I’m not sure about patches, but definitely service pack level upgrades), the process deletes and recreates all of the DB indexes and your indexes will no longer be around. Now, we’ve taken the approach of leaving that be, and only re-creating the indexes that seem to still be needed to keep Epicor performing well (another example: we ended up needing to create an index on PartMtl (or was it ECOMtl?) to keep Engineering Workbench from freezing up for 3-6 seconds every time you switched from one material record to another).

When adding a new index where one already exists for PartDtl, during the execution of DELETE for MRP what forces the system to use the new index as opposed to continue with the old index?

Is there any credence to adding an index to PartDtl for TFLineNum? The query from above:

delete a 
from Erp.TFOrdDtl a inner join Erp.PartDtl c on a.Company = c.Company and a.TFLineNum = c.TFLineNum 
inner join Erp.JobHead b on c.Company = b.Company and c.JobNum = b.JobNum where b.Company = 'MYCOMPANY' and b.JobClosed = 0 and b.JobFirm = 0

joins TFOrdDtl to PartDtl on TFLineNum. I see that PartDtl does not have an index for TFLineNum. Is there anything special I would need to do to “instruct Epicor” to use it? I did a Data Regen on the database. Data Dictionary Viewer sees the index I created. I’m just checking with my educated peers to see if I’m overlooking something obvious or making poor assumptions.

I usually only add an index when one is suggested when running with “Show Actual Execution Plan” checked in SSMS. Not saying that is the only good indexes to add, I just haven’t ventured out beyond that “shallow water.” Also, its my understanding that if you add an index that the Query Optimizer in SQL is already finding and suggesting you add, then the Query Optimizer itself will most likely switch to using your added index when running the query or queries that caused the suggestion in the first place. Basically put - nothing you need to do to switch Epicor to using the new index, it’s all handled by the SQL query engine.

1 Like